


There is shifting demographics in USA and in major industrialized countries, and industries have not kept up with this demographic shift at various leadership levels, including the highest level which is the board of directors. This article begins to shed some light on this as part of our Economic and Social Justice Program (ESJP). Needless to say, such deficiency exists in our civil society as well when we look at elected officials and bureaucrats in public service, but that is a related and separate topic that our MyLLife Scholars Program in public policy is trying to address in small but incremental ways by encouraging young college students of minority and immigrant backgrounds to seek internship in public policy at federal, state and local levels.
Over the last year on ESJP front, we have been collecting data on corporate revenue and profit, balance sheet, employment and wages, environmental footprints, corporate governance and philanthropy, etc. to provide data driven assessment of large corporation’s impact on society which has been coined as their Corporate Social Responsibility (CSR).
Regarding board composition, we looked at the largest ten corporations in ten different industrial sectors such as technology, retail, energy, transportation, healthcare, food and beverage, etc., given the impact of these corporations in not only industrial societies but across the globe in terms of products and services they provide but also, the way they extract resources from the planet and from societies around the world.
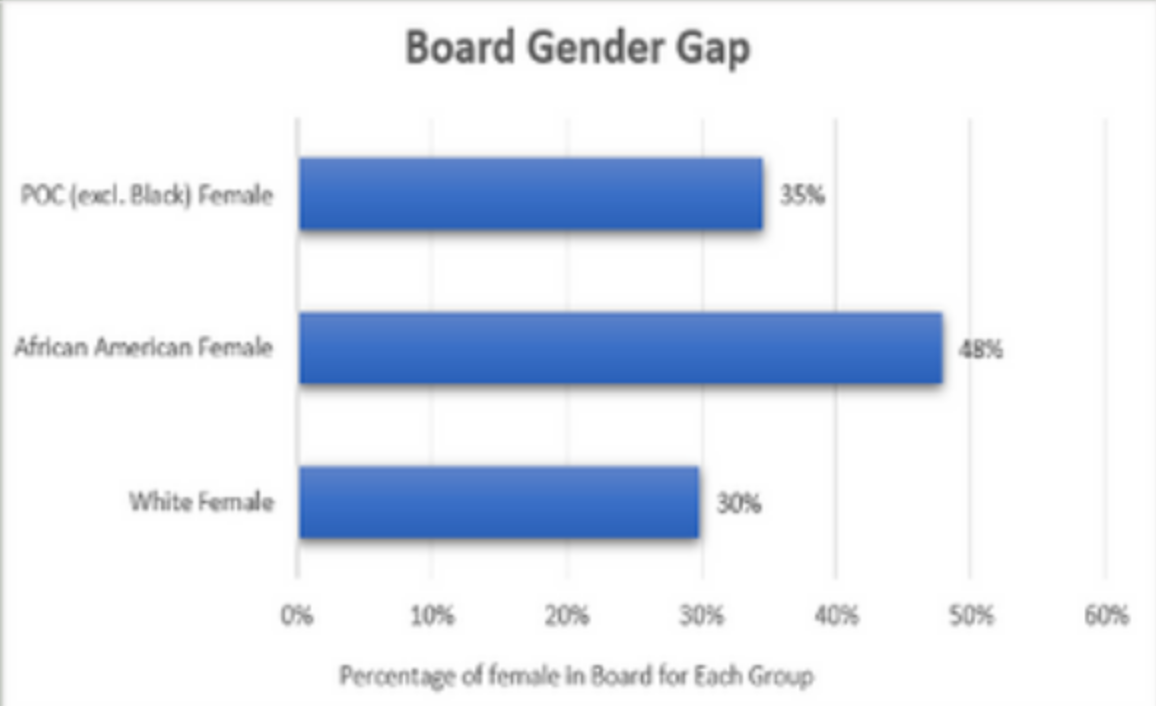
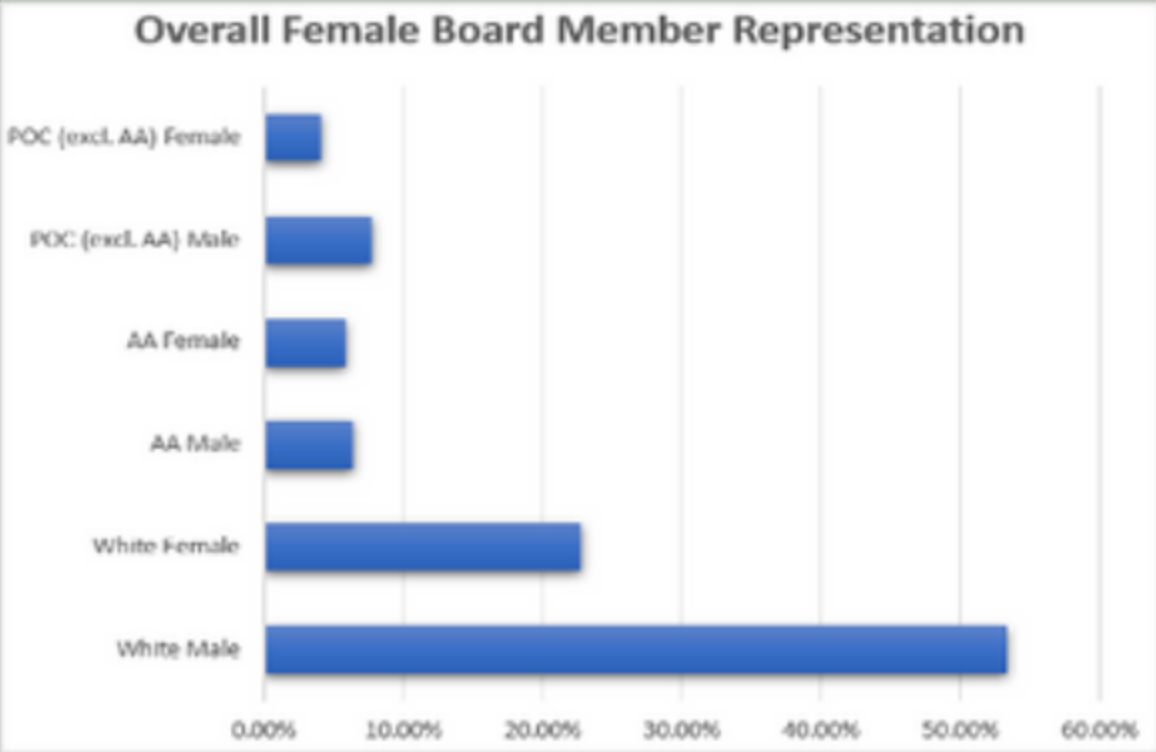
Across these 100 companies, there are 1131 board members, not considering that same person may sit on multiple boards at the same time, so the actual number of individuals who holds the highest level of responsibility in these companies will be less than the number quoted above. The average board size is 11 members, ranging from 8 in Food and Drugs to 13 in Financials sectors as shown in chart #1, even though there is no set guidance on the ideal number of board members for a corporation. The board is heavily skewed toward white and male as shown in chart #2 and #3. Chart 3 specifically shows the composition of board for Whites, African American (AA) and People of Color (POC) excluding AA.
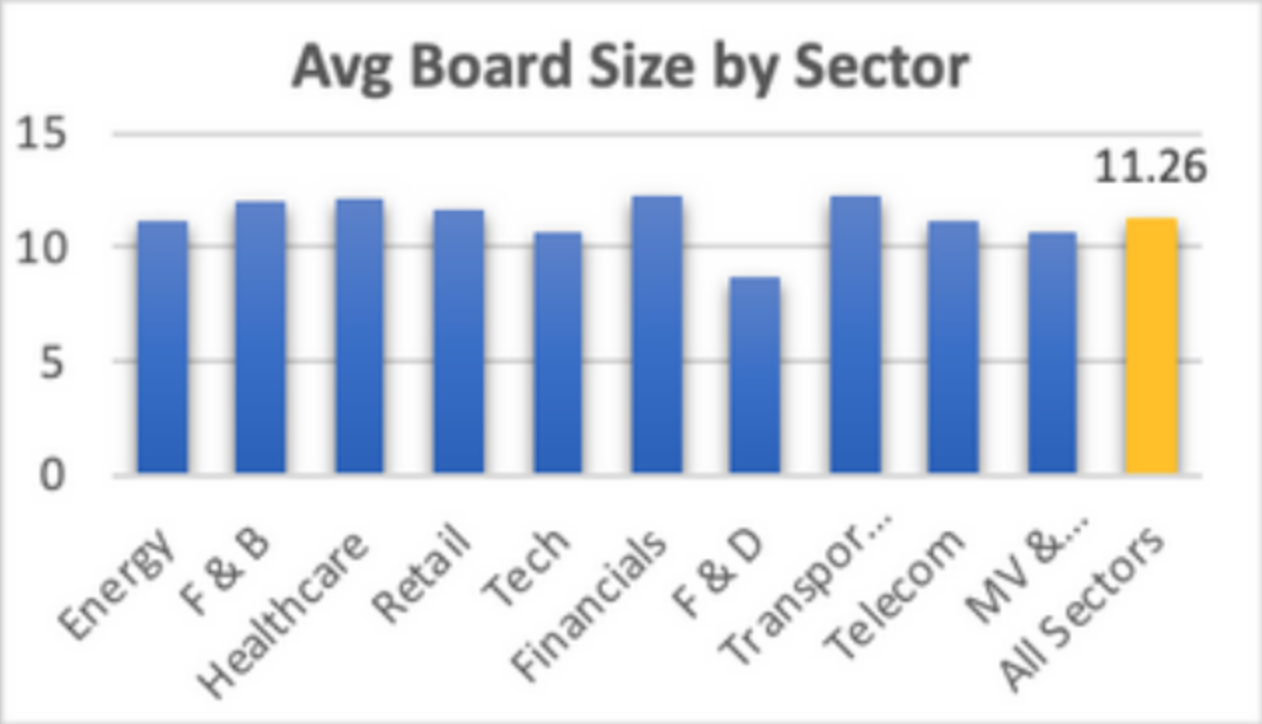
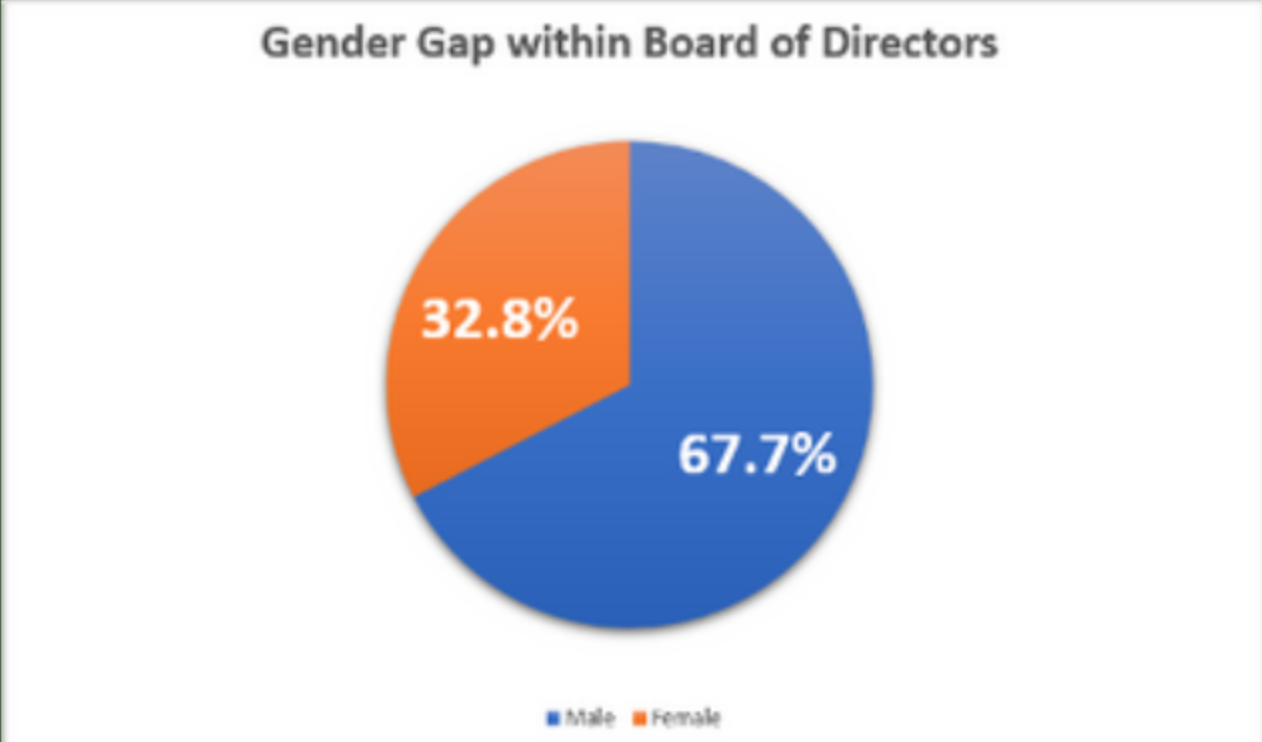
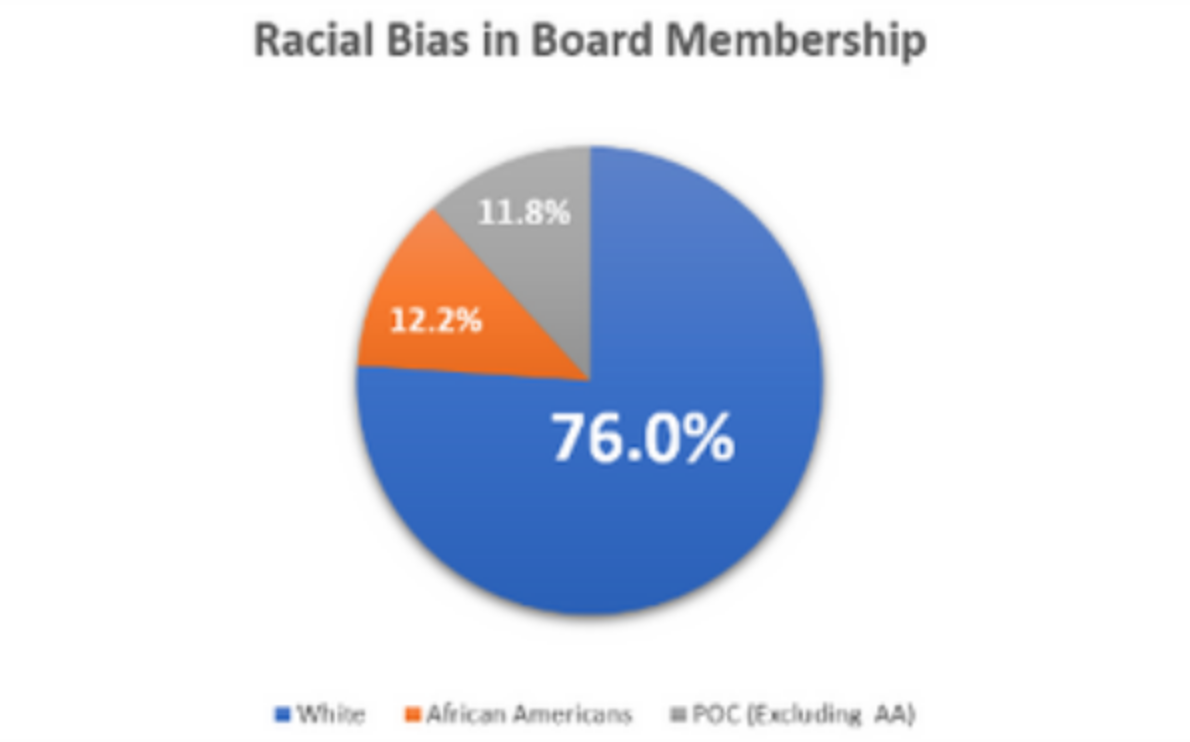
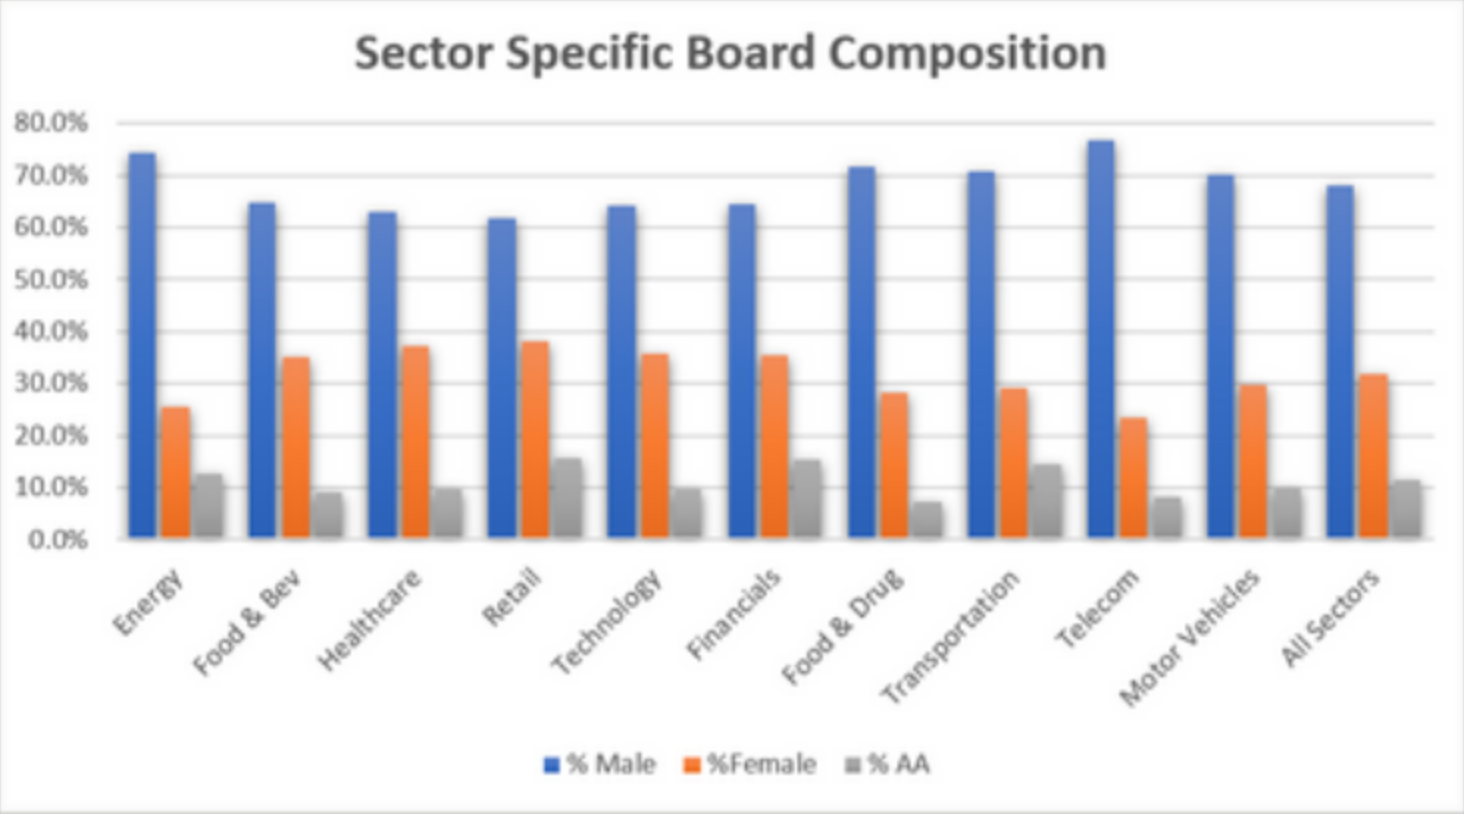
Chart 4 shows the composition of the board across all the 10 industrial sectors for male, female, and AA. Telecom and Energy sector have a particular challenge to attract and retain female board members while Technology, Food and Drug and Telecom also have difficulty in attracting and retaining AA board members.
This lack of representation and diversity within these boards shows lack of good governance and cannot provide adequate voice and perspective for employees, customers and communities who are as diverse as the market these companies serve. But representation is only one step among several other steps that company boards need to tackle at the same time to adequate serve all business stakeholders. MyLLife looks forward to exploring more findings and conducting insightful research in the future and share these in future issues of MyLLife Digest and other publications.