





The world economy is worth roughly $113.8 trillion. Muslim-majority states hold barely a tenth of it — but have nearly a quarter of the people. What does this gap reveal about wealth, economic power, and purchasing power parity?
In April 2026, the International Monetary Fund estimated the 2025 global nominal GDP at $113.8 trillion.1 The World Bank's 2024 nominal estimate is $111.3 trillion2 . The $2 trillion gap is a reminder that ‘the size of the world economy’ depends on whose methodology you use—and, by extension, so does every ‘share of world GDP’ figure that follows in this piece.”
The IMF and World Bank measure the same thing but use different data and methods. The main differences are:
(1) Timing — the IMF includes newer estimates, while the World Bank often uses confirmed data from an earlier year;
(2) Exchange rates — each may use different currency conversion methods, which changes GDP into U.S. dollars; and
(3) Estimates vs. confirmed data — the IMF relies more on projections, while the World Bank focuses on finalized national statistics.
Neither is wrong—they're just different snapshots. This is important because GDP percentages from different sources may not match exactly.
So how much of that $113.8 trillion belongs to the 57 member states of the Organisation of Islamic Cooperation (OIC), the closest thing to an official bloc of Muslim-majority economies? And what does the answer mean for the roughly one-in-four people on Earth who live in a Muslim-majority country?
OIC membership vs. Muslim-majority: which countries don't overlap
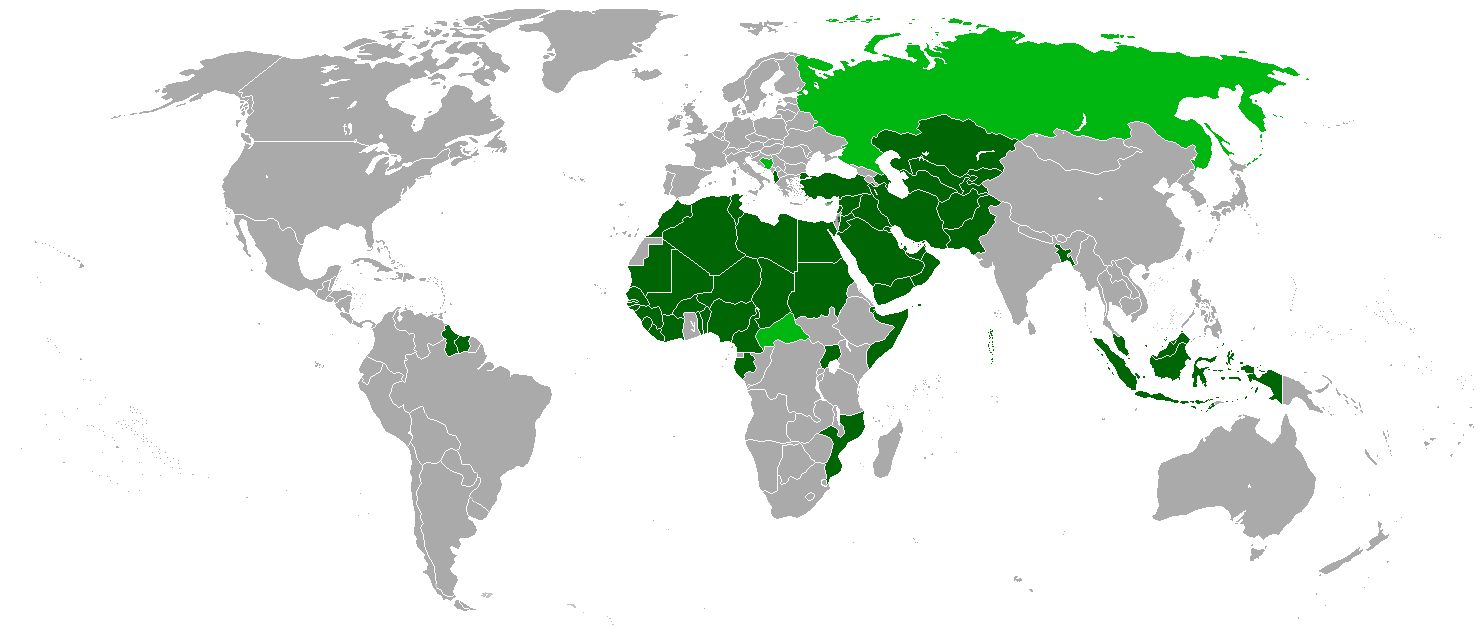
The OIC has 57 member states, but “OIC membership” and "Muslim-majority-country" are not interchangeable. The OIC admits any state with a significant Muslim population or cultural ties to the Islamic world, not only states where Muslims are the majority.
Sources differ on the exact count of Muslim-majority OIC members, depending on the population threshold used and the census year used, a data quality caveat worth noting. The most commonly referenced breakdown identifies eight full OIC members as majority non-Muslim: Benin, Cameroon, Gabon, Guyana, Mozambique, Suriname, Togo, and Uganda. These states joined primarily because of the significant Muslim minority population or diplomatic ties within the Islamic Conference, not because Muslim constitutes the majority.
Two additional members sit near the threshold and are classified differently across source: Guinea-Bissau and Côte d'Ivoire, each with Muslim populations at the 37–43% range, just below a majority by most counts, though some older OIC materials include them among the "49 Muslim-majority" figure.
This is why estimates of Muslim-majority countries within the 57-member OIC range from 48 to 51 depending on the source and the year. Throughout this piece, I use OIC aggregate economic data because it is the most consistently tracked bloc-level figure, while noting that OIC membership is an imperfect proxy for "the Muslim world."3
The World Economy, in Scale
Two economies dominate the global total. The United States and China account for 43.7% of world nominal GDP in 20254. This means the other 190-plus countries in the world split the remaining 56.3%. Global growth is projected at 3.16% for 2025, a modest uptick from 2.87% in 2024.4
Turkey is the highest-ranked Muslim-majority country at No. 16 with $1.60 trillion. Indonesia follows at No. 17 with $1.45 trillion, and Saudi Arabia ranked 19 with $1.28 trillion.5 Only three Muslim-majority countries make the top 20 economies. None cracked the top 15, and none come close to the nominal GDP of the top 10 countries.
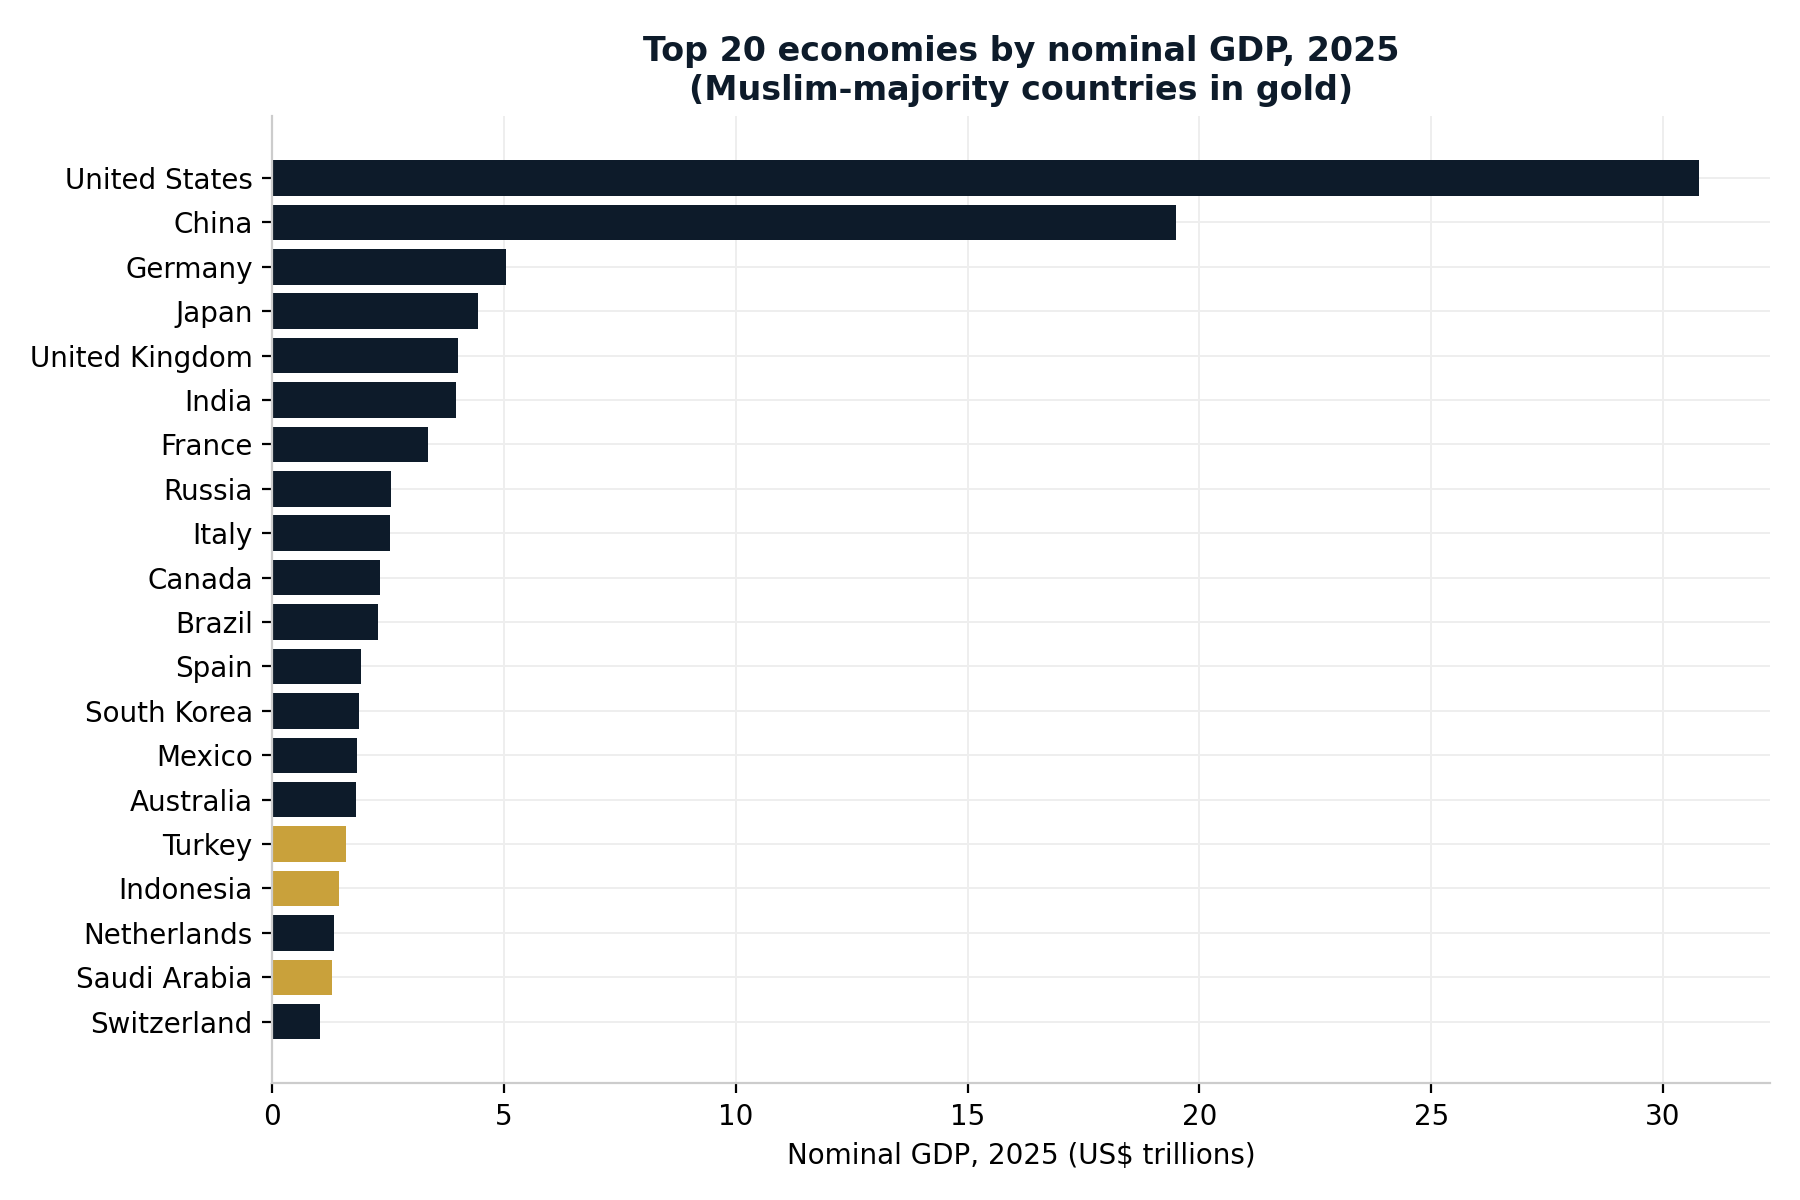
Figure 1. Top 20 economies by nominal GDP, 2025 (US$ trillions). Muslim-majority countries shown in gold. Source: IMF World Economic Outlook, April 2026, via Worldometers.⁵
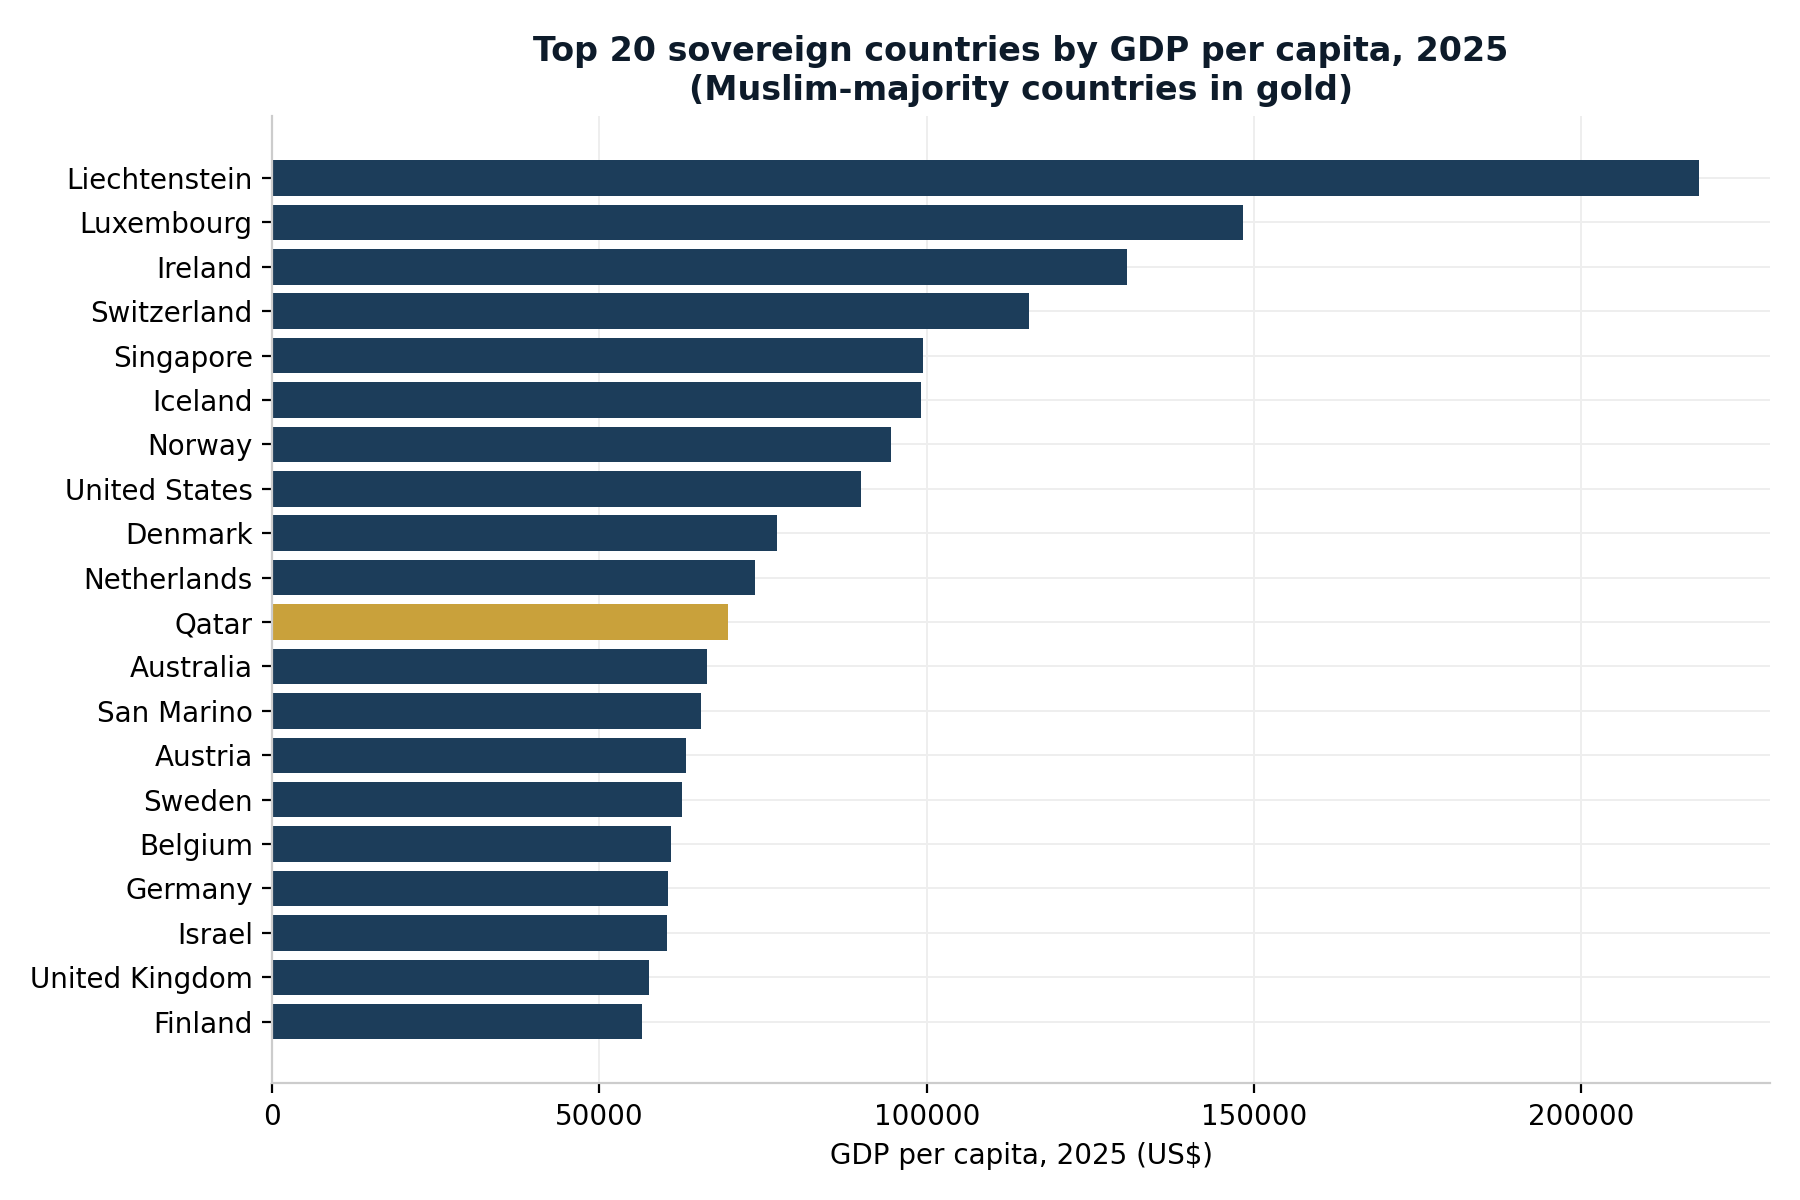
Figure 2. The top 20 economies, ranked by GDP per capita instead of total size (2025, US$). Muslim-majority countries shown in gold. Source: IMF/Worldometers.⁶
The Muslim-Majority (OIC) World's Share
Against that $113.8 trillion backdrop, the OIC's collective GDP was $9.2 trillion in 2024 — 8.3% of the global economy.7 Interestingly, that number has been remarkably static. It was around 8% in 2016 and has barely moved since. This means that a decade of individual growth has not been able to move the OIC bloc's overall weight in the world economy.
The picture however, looks very different in terms of purchasing power parity (PPP). PPP shows that OIC output reached $26.4 trillion in 2023, or 15.0% of global GDP8 — and by 2024 the PPP share had climbed slightly to 14.3%.7
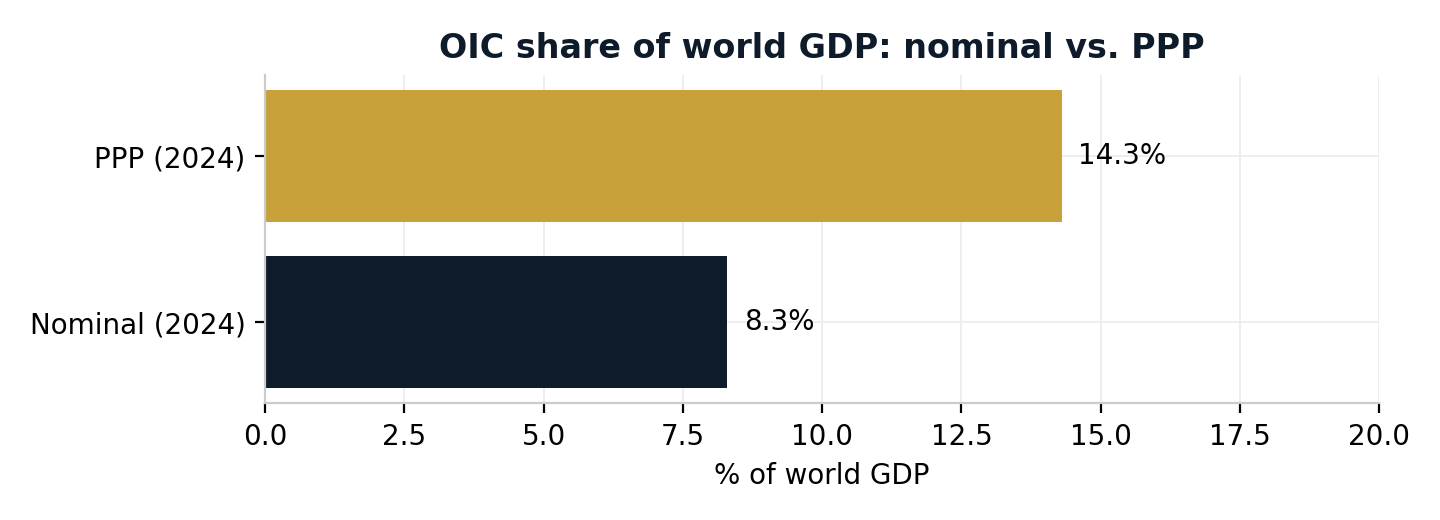
Figure 3. OIC share of world GDP: nominal vs. PPP terms. Sources: COMCEC/SESRIC, 2024; SESRIC, 2023.⁵,⁶
Why does the PPP share nearly double the nominal one? It is largely because a dollar buys more in Jakarta or Karachi than it does in New York or Zurich — nominal GDP, measured at market exchange rates, understates how much economic activity is actually happening on the ground in lower-cost economies. The gap is itself a data point as it suggests these economies are producing more real goods and services, and supporting more actual consumption, than their currency-converted GDP figures imply. However, this value isn’t captured in terms of globally tradable, hard currency.
Who's Carrying the Weight
Within the OIC bloc, economic size is heavily concentrated. Ranking the top 20 Muslim-majority economies shows how steep the drop-off is after the top three. Turkey ($1.60 trillion), Indonesia ($1.45 trillion), and Saudi Arabia ($1.28 trillion) lead, followed by the UAE, Malaysia, Bangladesh, Pakistan, Egypt, and Iran in the $350–575 billion range. By the time the list reaches Jordan, Sudan, and Tunisia at the bottom of this top 20, individual economies are under $65 billion — smaller than a single mid-sized U.S. metro economy.9
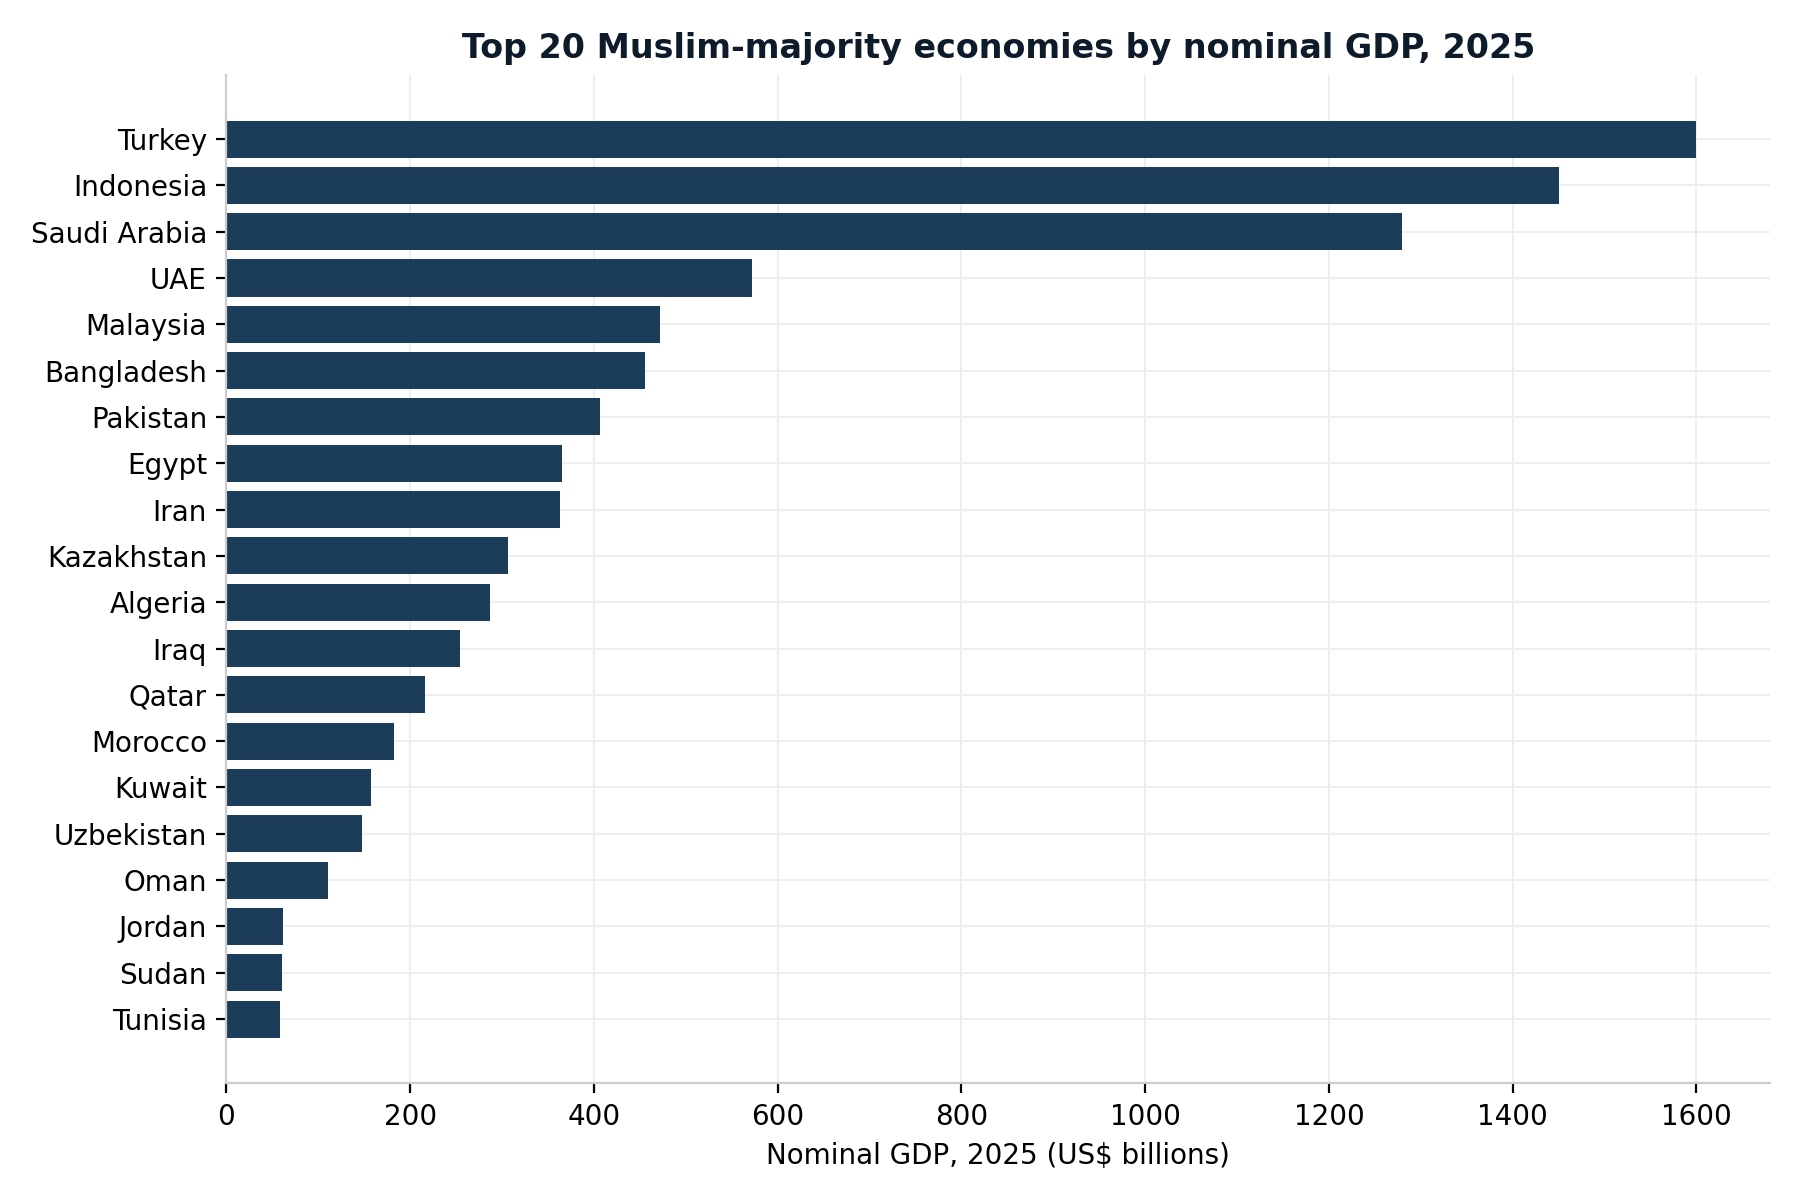
Figure 4. Top 20 Muslim-majority economies by nominal GDP, 2025 (US$ billions). Source: IMF WEO April 2026, via Worldometers, cross-referenced against OIC/Muslim-majority status.⁹
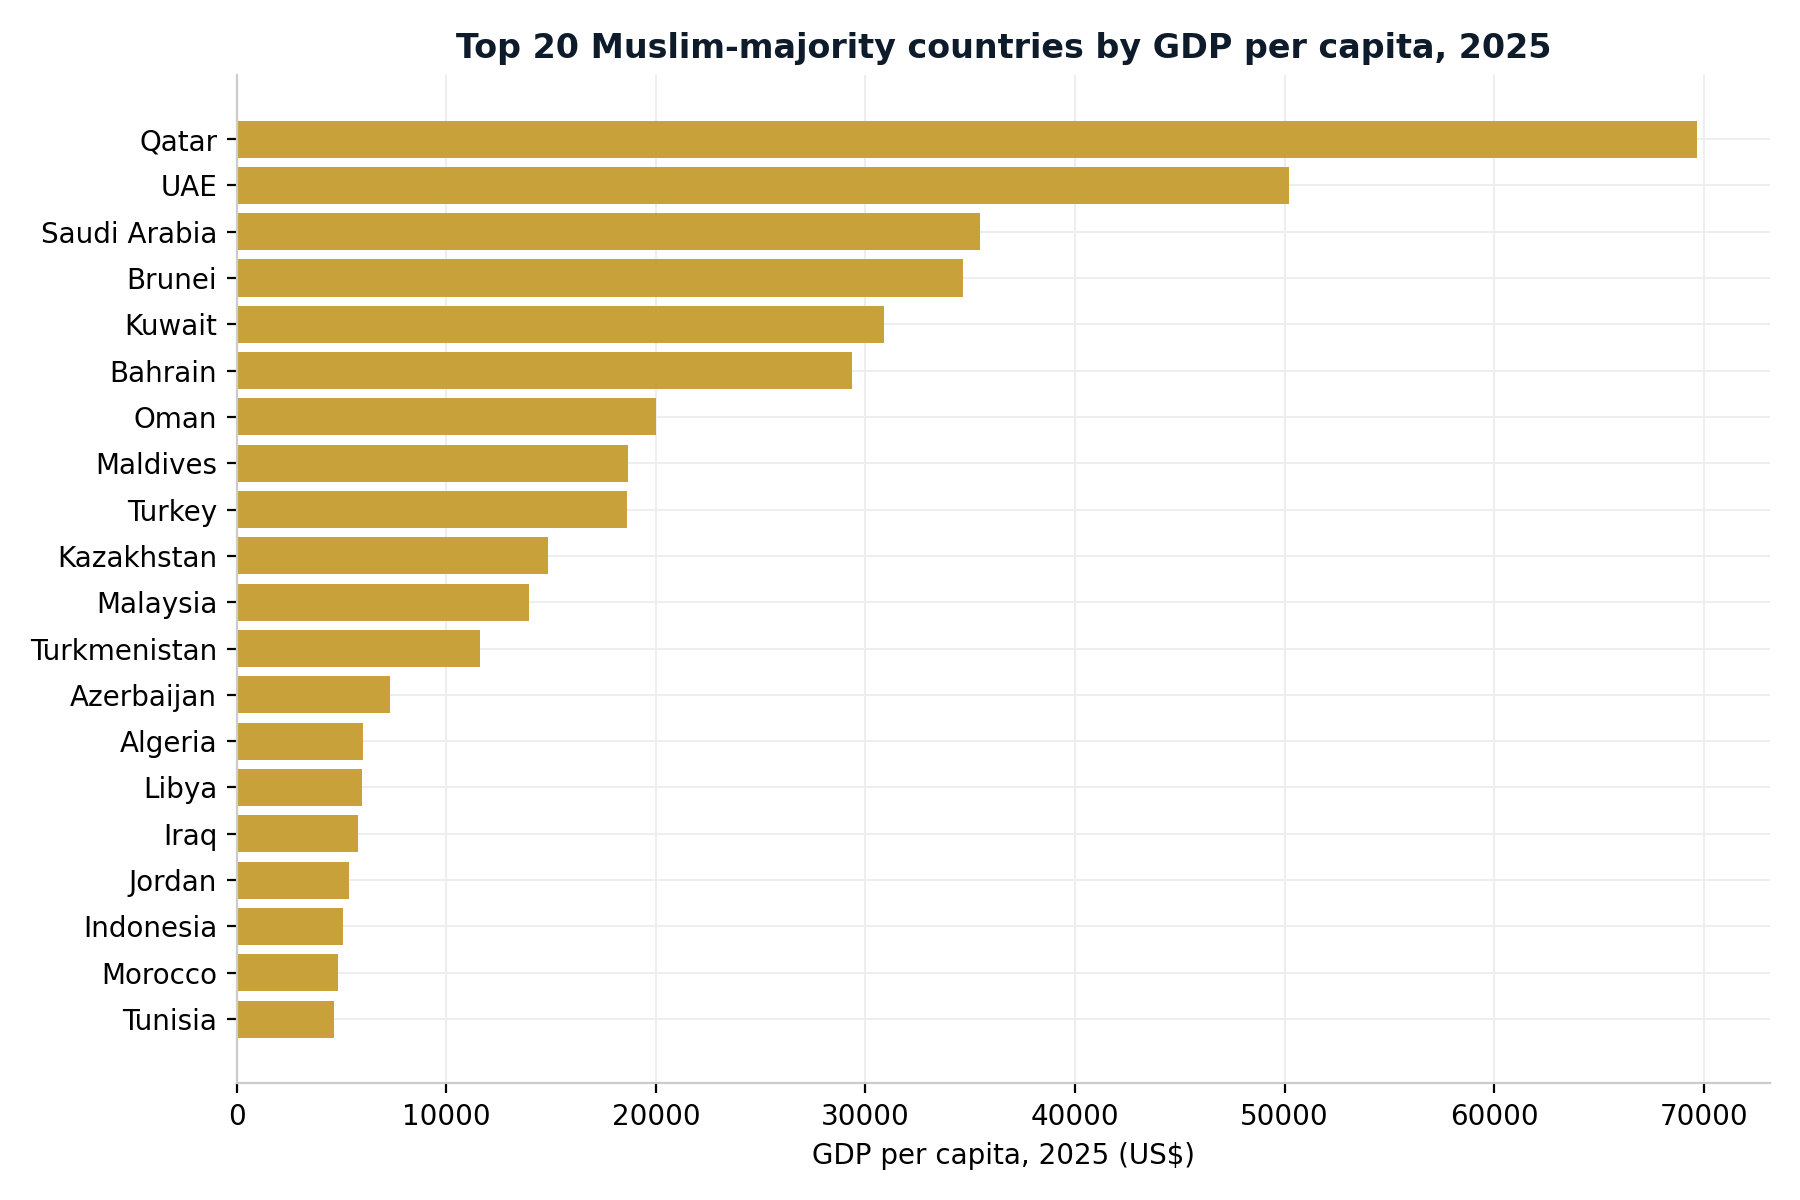
Figure 5. The top 20 Muslim-majority economies, ranked by GDP per capita (2025, US$). Source: IMF/Worldometers.¹⁰
The Per-Capita Reality Check
Aggregate GDP flatters a bloc that includes some of the world's richest and poorest states side by side. The world's nominal GDP per capita reached roughly $14,410 in 2025.9 Against that baseline, the spread inside the Muslim-majority world is extreme — from oil-and-gas states with among the highest per-capita incomes on the planet to some of the lowest.
Country | GDP/capita, nominal (2024) | GDP/capita, PPP (2024) | vs. world avg. (nominal) |
|---|---|---|---|
Qatar | $62,189 | $110,946 | ~4.3x |
Saudi Arabia | $24,917 | $62,677 | ~1.7x |
Turkey | $15,148 | $35,294 | ~1.1x |
Indonesia | $4,368 | $14,470 | ~0.3x |
Pakistan | $1,644 | $5,531 | ~0.1x |
World Bank data via Trading Economics, 2024 figures; world average per IMF, 2025.¹⁰
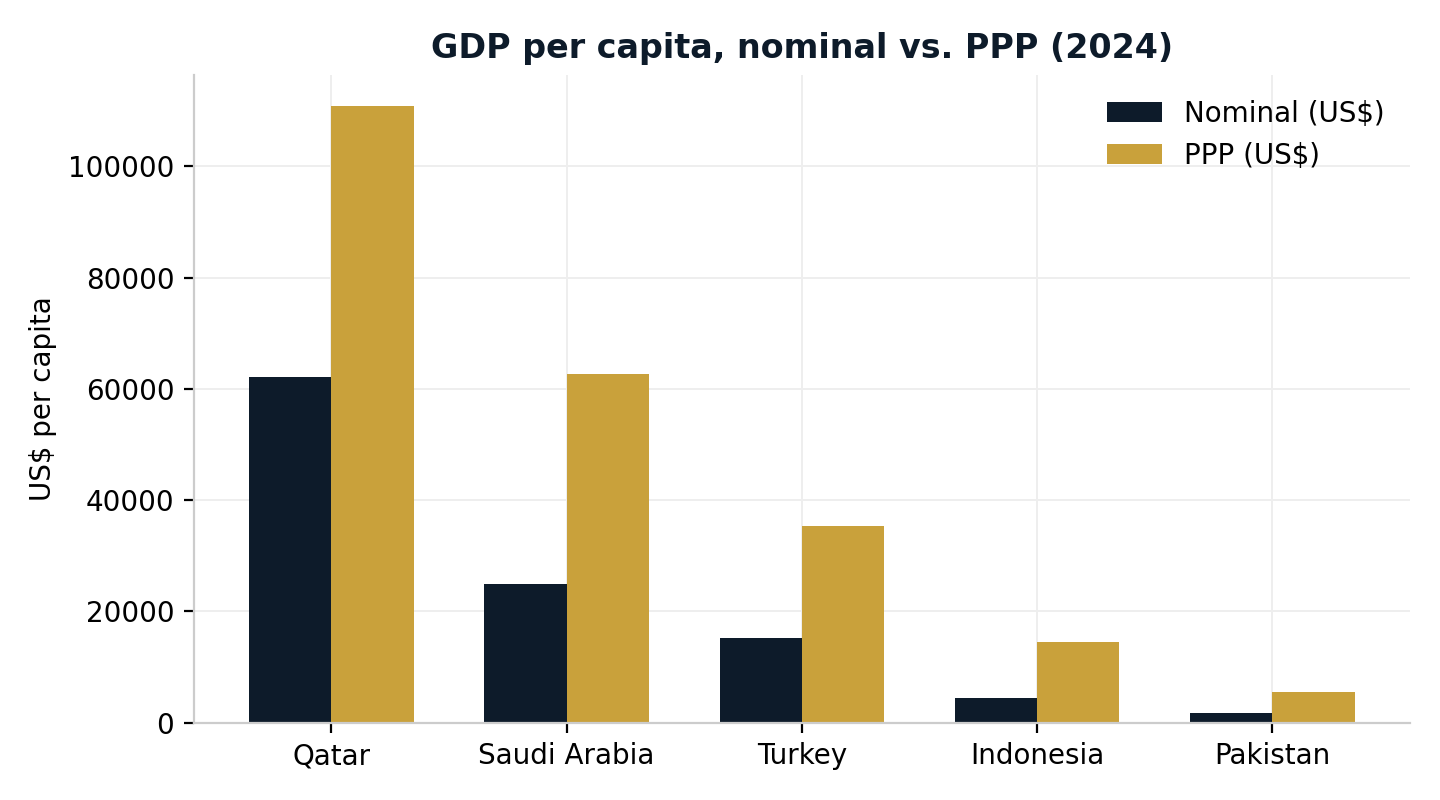
Figure 6. GDP per capita, nominal vs. PPP, selected Muslim-majority countries (2024, US$).¹⁰
Qatar's per-capita income runs more than four times the world average; Pakistan's sits at roughly a tenth of it. Averaging these into a single "Muslim world per capita income" figure — as headline comparisons often do — erases that spread entirely. The bloc isn't one economy at one income level; it's a handful of hydrocarbon-rich outliers next to several of the most populous, lower-income countries on Earth.
The Youth Dividend
The demographic backdrop is where the bloc's long-run story gets more interesting. As of 2020, the global median age among Muslims countries was 24, nine years below the non-Muslim median of 33.11 Fertility tells the same story: a Muslim woman has an average of 2.9 children over her lifetime, compared with 2.2 for non-Muslim women.11
Scale matters here too — the global Muslim population passed 2 billion in 2023, more than a quarter of humanity.12 Put differently: the bloc holding roughly 8% of world GDP nominally is home to over 25% of the world's people, and that population is younger and growing faster than the global average.
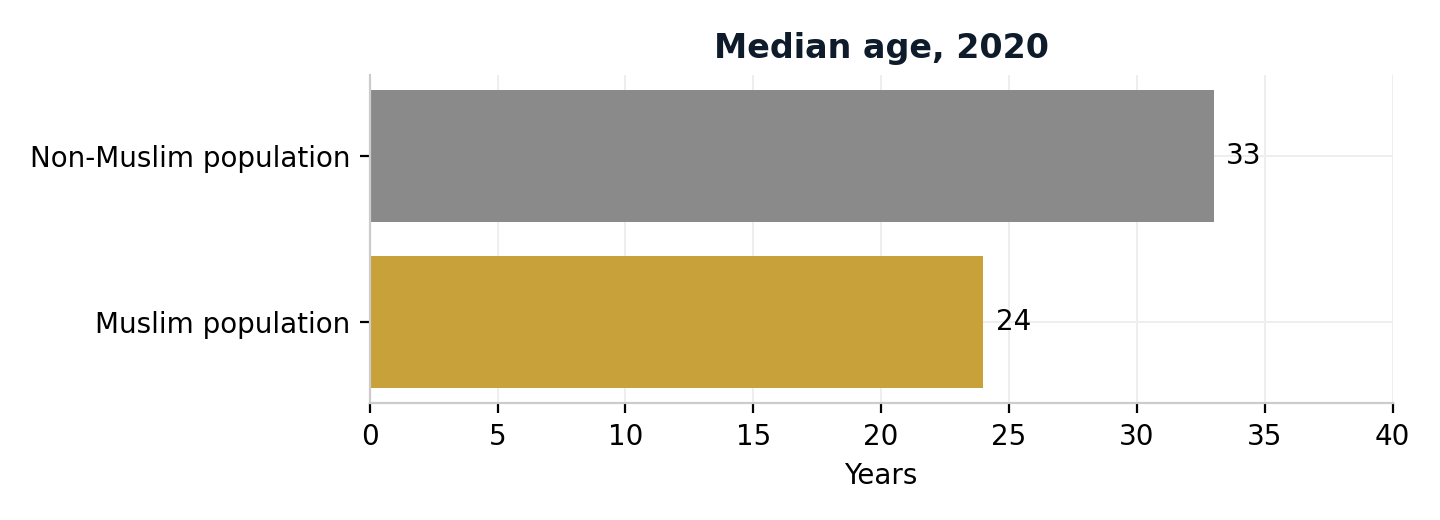
Figure 7. Median age, Muslim population vs. non-Muslim population, 2020. Source: Pew Research Center.¹¹
A young, growing population is not automatically an economic asset — it's a bet that only pays off if paired with education, job creation, and investment fast enough to absorb the incoming workforce. Without that, a youth bulge becomes a youth unemployment problem rather than a dividend. Either way, it's the single biggest reason to expect the population-to-GDP gap to be a live question over the next two decades rather than a settled one.
What These Economies Run On
Structurally, OIC output breaks down as roughly 48.5% services, 25.2% non-manufacturing industry (dominated by hydrocarbons), 16.2% manufacturing, and 10.1% agriculture.7 Set against the global sector split — 66.2% services, 10.9% non-manufacturing industry, 15.1% manufacturing, and 4.0% agriculture — the contrast is sharp on two fronts: OIC economies collectively run a much smaller services sector than the world average, and a much larger agriculture sector.14
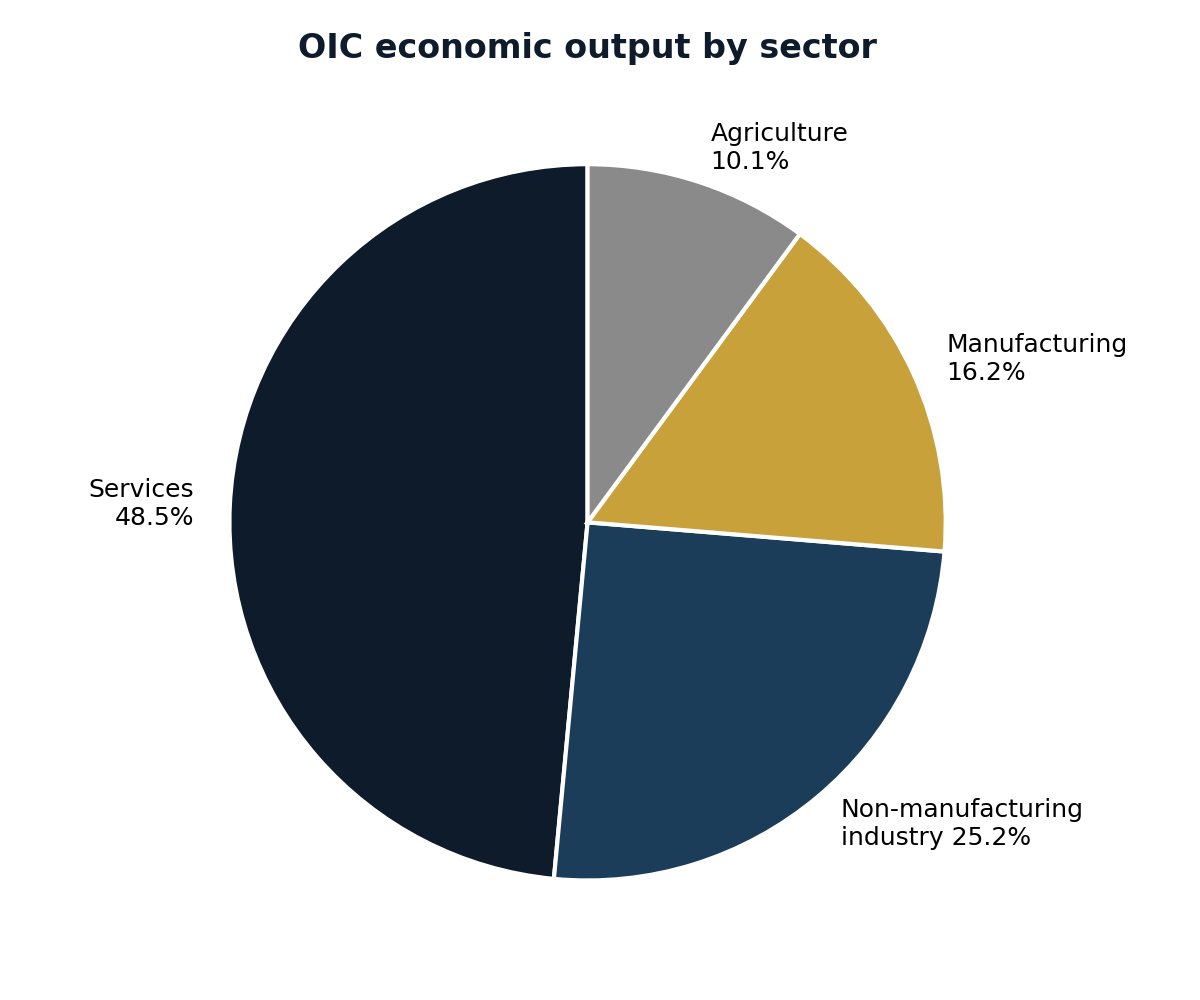
Figure 8. OIC economic output by sector. Source: COMCEC/SESRIC, OIC Economic Outlook 2025.⁵
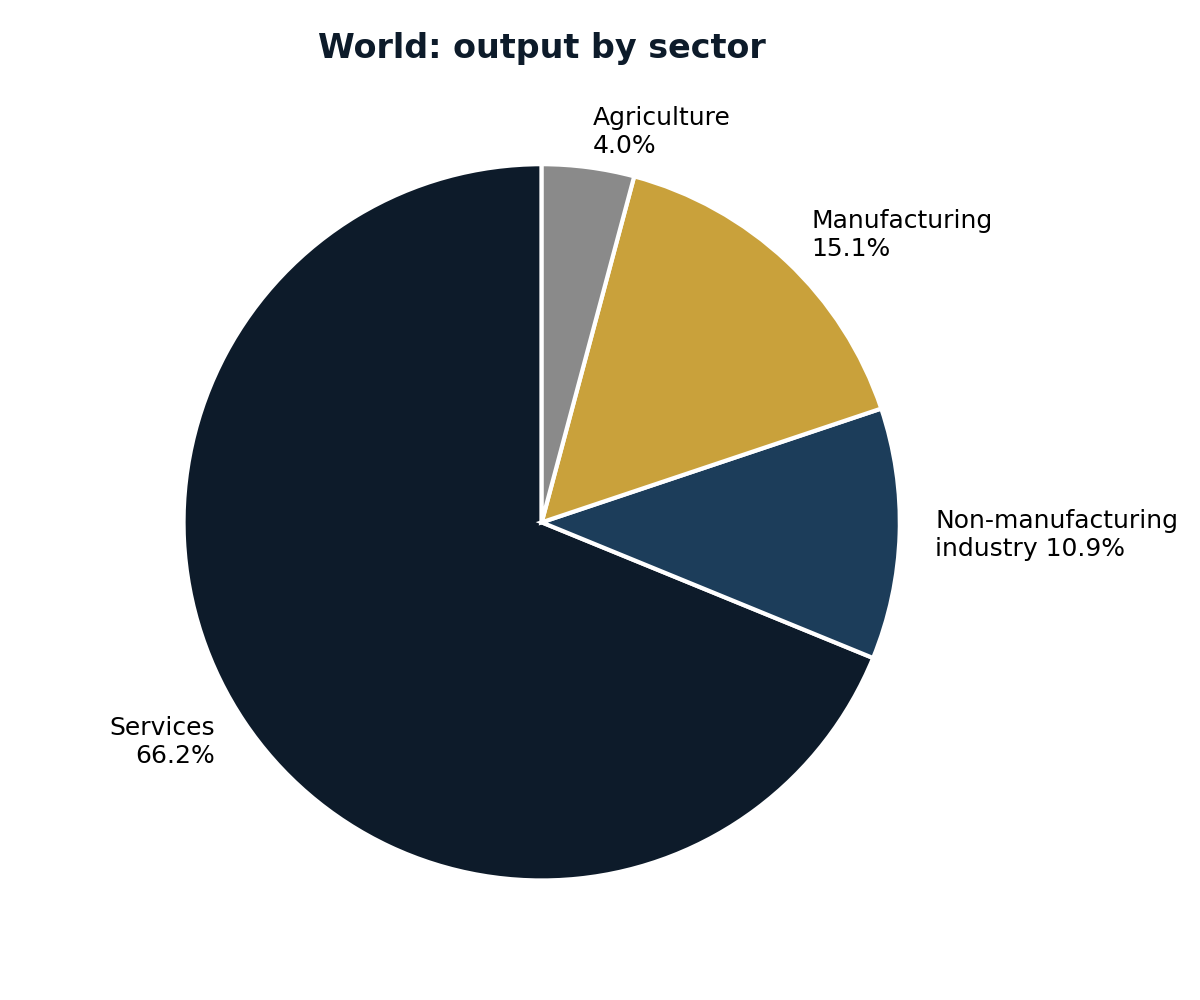
Figure 9. World: output by sector, for direct comparison. Source: World Bank, 2024.¹⁴
This gap in services share is largely hydrocarbon story: heavy reliance on oil and gas exports in Gulf economies pulls the OIC's non-manufacturing-industry share well above the global average, crowding out room for the kind of finance, tech, and professional-services growth that has come to dominate advanced economies. Turkey, Indonesia, Malaysia, and Bangladesh have built comparatively diversified manufacturing bases that push against these norms.
The bloc's own trade-integration push reflects an attempt to diversify from the inside: COMCEC, Committee for Economic and Commercial Cooperation, has targeted raising intra-OIC trade to 25% of members' total trade volume by 2025, and by 2024, 30 member countries had individually met or exceeded this threshold.7
Islamic finance and the halal economy are part of that diversification push. Social media sentiment analysis covering October 2023 to March 2025 found that 15.6% of global online conversations actively endorsed ethical, faith-aligned alternative brands15 — a signal that consumer demand for Sharia-compliant and values-based products is becoming a measurable global trend, not a niche one.
Constraints and Headwinds
Fiscal pressure varies enormously across the bloc's larger economies — and it helps to see that variance next to the global average rather than in isolation. The IMF puts the world's average government debt-to-GDP ratio at 94.7% in 2025, up from 92.4% the year before.16 Saudi Arabia's government debt sat at 31.7% of GDP in 202517 and Turkey's at roughly 24–27% of GDP18,19 — both far below the global average. Both countries are cited as examples of economies that have actively reduced their debt burden over the past two decades.19
Egypt and Pakistan sit closer to the global average with Egypt's debt-to-GDP ratio at 83.8% in 202520, and Pakistan at roughly 83%21 — both still below the 94.7% world average, but well above the 60% threshold the IMF typically flags as a sustainability concern for emerging economies.
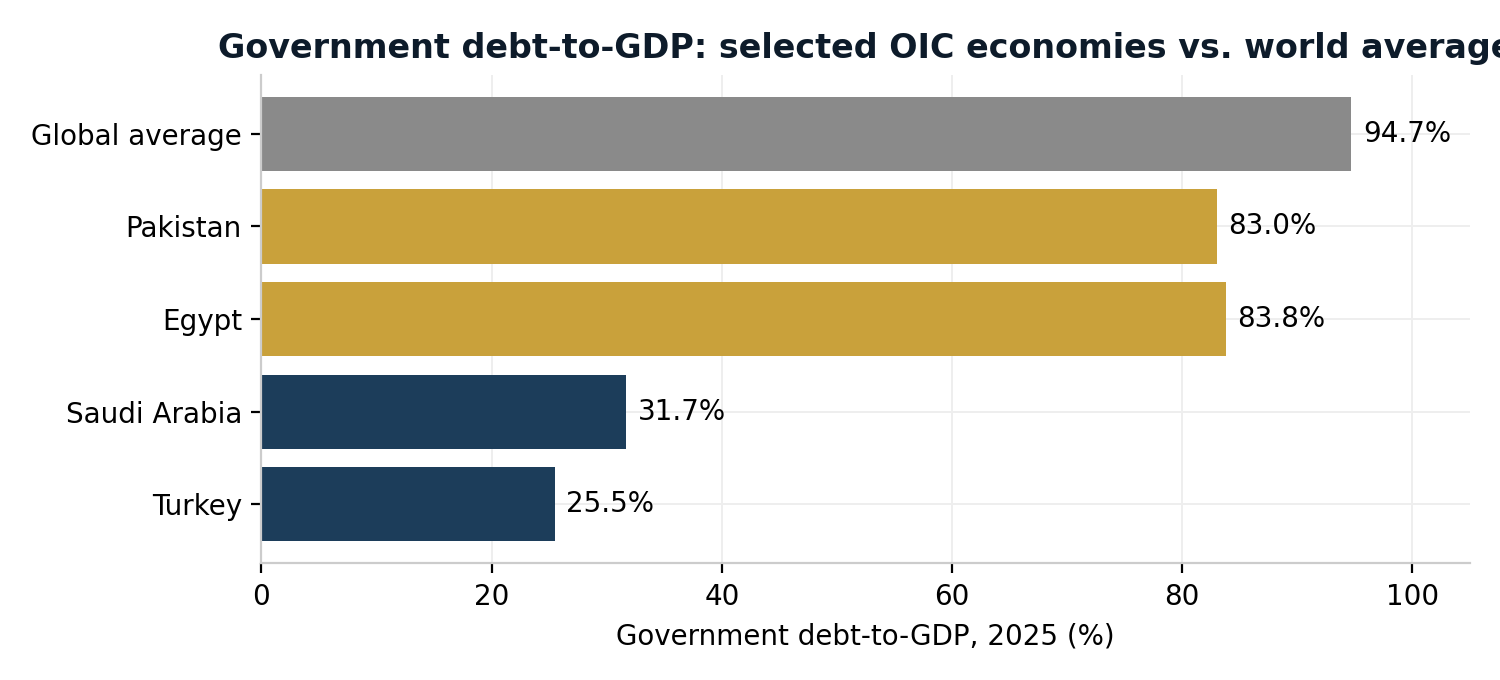
Figure 9. Government debt-to-GDP: Turkey, Saudi Arabia, Egypt, and Pakistan vs. the 2025 world average. Sources: Trading Economics/national central banks; IMF WEO October 2025 for the global average.¹⁶⁻²¹
Investment flows add another headwind. OIC countries hosted just 4.9% of global inward foreign direct investment (FDI) stocks in 2023, down from 5.7% in 2019, while developed countries continued to absorb the bulk of global FDI — 75.8% of the total in 2023.8 The 2025 OIC Economic Outlook also flags trade and tariff policy exposure as a live risk factor heading into 2026.7
The Gap — and the Trajectory
Line the numbers up and the core tension is clear: roughly 8.3% of world GDP in nominal terms, 14–15% at PPP, against a population share north of 25%.5,12 By any of these measures, the Muslim-majority world is carrying less economic weight than its population would suggest — and that gap has barely narrowed over the past decade.
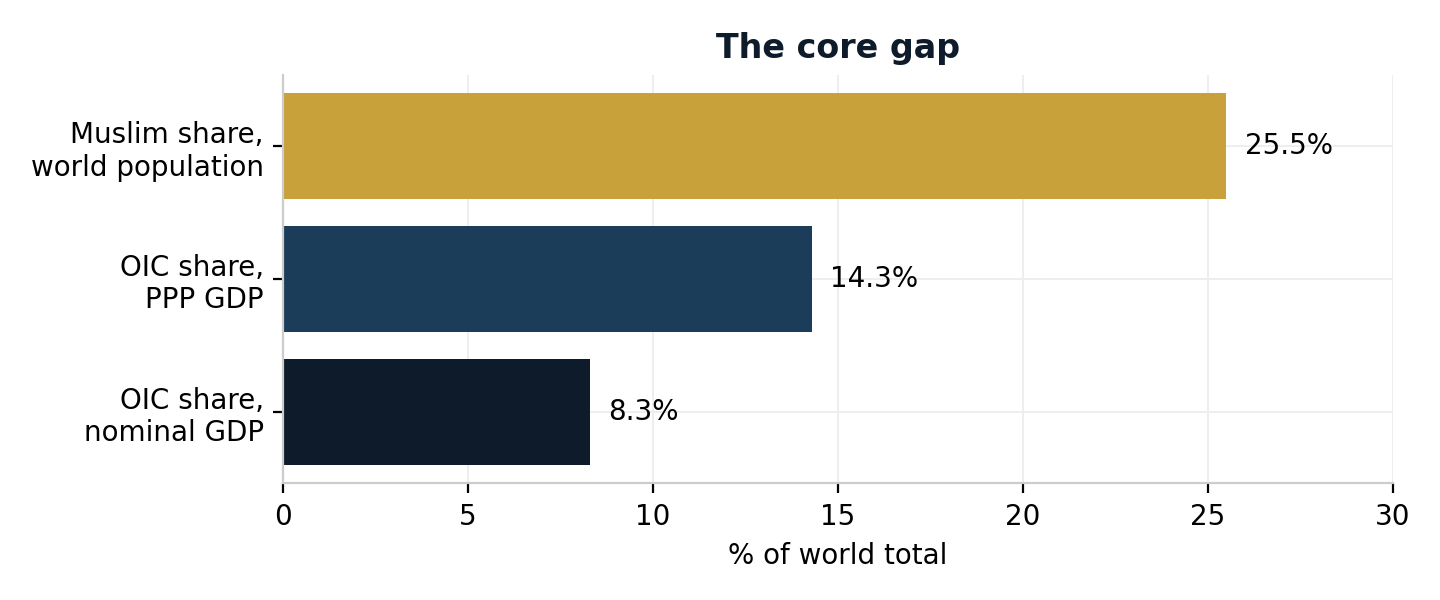
Figure 7. The core gap: OIC share of world GDP (nominal and PPP) vs. Muslim population share of world population.
Whether that gap closes is an open question, not a forecast. The demographic base — a median age nine years younger than the rest of the world, and a fertility rate roughly a third higher — sets up a labor force that will keep expanding for decades. Whether that translates into a rising economic share depends on variables this piece hasn't measured: education investment, job creation, debt sustainability in economies like Egypt and Pakistan, and whether the intra-OIC trade integration and Islamic-finance diversification efforts scale beyond their current base. The population dividend is on the table. What gets built on top of it is still being decided.
References
1. International Monetary Fund. World Economic Outlook Database, April 2026.
2. World Bank. Global Economic Prospects, June 2025.
3. Wikipedia, "Member states of the Organisation of Islamic Cooperation," cross-referenced with Pew Research Center Muslim population-share estimates by country, 2025.
4. StatisticsTimes.com, analysis of IMF World Economic Outlook data on world GDP and growth projections, 2025.
5. IMF World Economic Outlook, April 2026 (NGDPD), top 20 economies by nominal GDP, via Worldometers.info.
6. IMF World Economic Outlook, April 2026, GDP per capita (nominal), via Worldometers.info.
7. SESRIC / OIC (COMCEC). OIC Economic Outlook 2025: Pathways to Stability Amid Tariff Impacts.
8. SESRIC / OIC. GDP (PPP) and foreign direct investment statistics, 2023 data release.
9. IMF World Economic Outlook, April 2026 (NGDPD), via Worldometers.info, filtered to OIC/Muslim-majority member states.
10. IMF World Economic Outlook, April 2026, GDP per capita (nominal), via Worldometers.info, same country set as ref. 9.
11. IMF/World Bank GDP per capita data, 2025, via Worldometers.info.
12. Pew Research Center. "How the Global Religious Landscape Changed From 2010 to 2020," June 2025.
13. SeasiaStats, analysis of global Muslim population data, 2023.
14. World Bank / Trading Economics, world services, industry, manufacturing, and agriculture value-added as % of GDP, 2024.
15. DinarStandard. State of the Global Islamic Economy Report 2024/25.
16. Visual Capitalist / Voronoi, analysis of IMF World Economic Outlook October 2025 government debt data, global average.
17. Trading Economics, citing Saudi Arabia National Debt Management Center / Ministry of Finance, government debt-to-GDP, 2025.
18. Trading Economics, citing Turkey Undersecretariat of Treasury, government debt-to-GDP, 2024–2025.
19. Visual Capitalist, analysis of IMF October 2025 World Economic Outlook government debt data, 2005–2025.
20. Trading Economics, citing Central Bank of Egypt, government debt-to-GDP, 2025.
21. Trading Economics, citing Central Bank / State Bank of Pakistan, government debt-to-GDP, 2025.
If you found this article informative & would like to support further research, click here to donate!
