




This article examines how global wealth, GDP, stock-market value, sovereign capital, and land are distributed across religious groups, with a focus on the world's Muslim population — both within Muslim-majority countries and as a minority elsewhere.
The World's Largest Economies and Muslim Population Share vs. Global GDP and Wealth
Of the world's top 20 economies by 2026 nominal GDP, only Indonesia, Turkey, and Saudi Arabia are Muslim-majority, and none ranks in the top ten (IMF, World Economic Outlook, April 2026). Six of the other top-20 economies — India, Russia, China, France, Germany, and the UK — host substantial Muslim minority populations of their own, a theme this article returns to below.
Muslims are an estimated 24-26% of the global population, the second-largest and fastest-growing major religious group in the world (Pew Research Center, 2025). Against that population share, every available economic measure shows underrepresentation: about 8.5% of nominal world GDP, roughly 18% on a purchasing-power-parity basis, and just 5.8% of global household wealth (Salaam Gateway/OIC; global wealth-by-religion research) — a population share running roughly four times the wealth share, consistent across independent datasets and methodologies.
Full country-by-country GDP rankings, the underlying data tables, and the population-vs-wealth charts are maintained on the companion data page: The Global Muslim GDP — myllife.org.
Stock Markets, Sovereign Wealth Funds, and Land Mass
Stock markets
Saudi Arabia is the only Muslim-majority country among the world's twenty largest equity markets: its exchange is valued at roughly $2.63 trillion, about 250% of GDP, buoyed by the Saudi Aramco listing (List of countries by stock market capitalization, 2026 data). The UAE's market is worth about $1.05 trillion (209% of GDP), Indonesia's about $940 billion (66% of GDP), and Malaysia's about $508 billion (107% of GDP) (same source). Turkey, while home to one of the largest stock exchanges in the Muslim world, remains significantly smaller, with a market capitalization of roughly $285 billion, equal to about 29% of GDP. This highlights the uneven development of equity markets across Muslim-majority economies: while Saudi Arabia and the UAE host exchanges that are very large relative to their economies, countries such as Turkey and Indonesia rely more heavily on banks and other forms of financing.
Beyond these, capital markets across the Muslim-majority world are comparatively shallow: about 38 of 56 Muslim-majority countries operate formal exchanges, but market capitalization in most sits below 50% of GDP — versus more than 170% in the US — with banking and energy stocks making up roughly 60% of listed value (Halal Times, 2025). Sharia-compliant investing has nonetheless gone mainstream globally: benchmark families such as the FTSE Yasaar Global Equity Shariah Index Series and the MSCI World Islamic Index track thousands of companies, and Islamic finance now has a footprint in about 140 countries (LSEG, 2026).
Sovereign wealth funds
Hydrocarbon revenue in Muslim-majority countries sits less in listed household equity and more in state-owned sovereign wealth funds (SWFs). Saudi Arabia's Public Investment Fund manages an estimated $1.3 trillion, Kuwait's Kuwait Investment Authority roughly $1 trillion, and Qatar's Qatar Investment Authority about $580 billion; UAE federal and emirate-level funds, including Abu Dhabi's ADIA and Mubadala, together hold more than $2.6 trillion (Visual Capitalist, 2026). Collectively, Gulf OIC-member funds rank among the world's ten largest SWFs, trailing only Norway's roughly $2 trillion Government Pension Fund Global and China's state investment vehicles among individual national funds (Altss, 2026; Universal Asset Owners, 2026). China's sovereign wealth assets are primarily managed through two state investment vehicles: the China Investment Corporation (CIC), with roughly $1.3-1.6 trillion in assets, and SAFE Investment Company, which manages a substantial portion of China's foreign-exchange reserves and is estimated to hold approximately $1.8-2.0 trillion. Together, these vehicles make China the world's largest state investor after Norway.
As with oil and gas reserves, this capital is state-controlled rather than distributed as diversified household net worth — part of why Gulf states combine very high per-capita GDP with a national wealth profile that looks different from household wealth-by-religion data collected elsewhere.
Land mass
The 57 OIC member states span a collective land area of about 31.66 million km² (Organisation of Islamic Cooperation, citing Worlddata.info), described elsewhere as roughly one-sixth to about one-fifth of the world's total land area depending on the denominator used (SESRIC, 2011). Muslim-majority countries account for a larger share of the world's land area than their roughly 24% share of the global population would suggest. This reflects the geographic distribution of Muslim populations across Africa, the Middle East, Central and South Asia, and Southeast Asia. Several Muslim-majority states, including Kazakhstan, Saudi Arabia, Algeria, and Indonesia, rank among the world's largest countries by land area. Much of this land is arid or sparsely populated (Libya and Mauritania average roughly 3 people per km²), which is one reason the group's outsized land area does not translate into a matching share of world GDP or wealth (SESRIC, "Population Structure of the OIC Member Countries," 2007).
Global Wealth, Millionaires, and Billionaires by Religion
A widely cited cross-country study of global household wealth by religious affiliation finds Christians hold the largest share of total world wealth, followed by the religiously unaffiliated/other, then Muslims, Hindus, and Jews.
Religious group | Share of global wealth | Share of global population* | Wealth-to-population ratio** |
Christians | 55.0% | ~30.8% | 1.79x |
Unaffiliated & other religions | 34.8% | ~32% | 1.09x |
Muslims | 5.8% | ~24.1% | 0.24x |
Hindus | 3.3% | ~15.2% | 0.22x |
Jews | 1.1% | ~0.2% | 5.50x |
*Population shares based on Pew Research Center global religious composition estimates. **Wealth share divided by population share.
This pattern reflects geography more than religion itself. Christian populations concentrate in high-income North America, Western Europe, and Oceania; the unaffiliated and other-religion share is driven by large populations in wealthy, secular China, Japan, South Korea, and Singapore; Muslims and Hindus are concentrated in developing and middle-income economies; and the small but wealthy global Jewish population reflects a similar geographic concentration in high-income countries. Differences are best explained by geography, development, education, and historical accumulation rather than religion itself (UNU-WIDER, "The Global Distribution of Household Wealth").
Millionaires
A New World Wealth dataset on the religious composition of the world's 13.1 million millionaires shows the same pattern more sharply: Muslims are roughly 24% of world population but an estimated 6.5% of millionaires; Hindus show a similar gap (15.2% vs. 3.9%); Jews are dramatically overrepresented (0.2% vs. 1.7%). Seven of the ten wealthiest countries by number of millionaires are "Christian-dominated," indicating country-level effects drive much of the pattern (New World Wealth, 2015, cited by CNBC and secondary sources). One important factor is the legacy of European colonialism. Many of today's wealthiest countries accumulated capital, industrial advantages, global trading networks, and financial institutions during centuries of colonial expansion, while large parts of Africa, South Asia, and the Middle East experienced extractive political and economic structures that often hindered local capital formation. As a result, contemporary wealth disparities reflect not only current economic performance but also historical differences in access to industrialization, global markets, and accumulated capital.
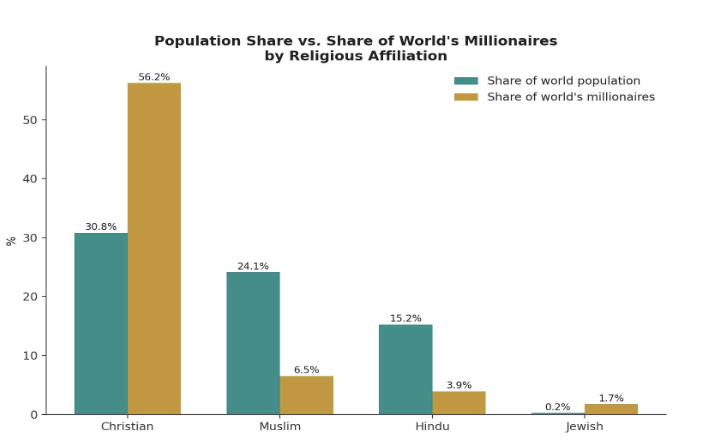
Share of world population vs. share of world's millionaires, by religious affiliation. Source: New World Wealth (2015), cited by CNBC and multiple secondary sources.
Billionaires
At the very top of the wealth pyramid, the same skew appears again and grows more pronounced. A Wealth-X billionaire census breakdown finds Christians represent an estimated 66.2% of the world's billionaires, Hindus
9.3%, Jews 6.5%, Muslims 6.3%, and other/unspecified faiths 11.7%.
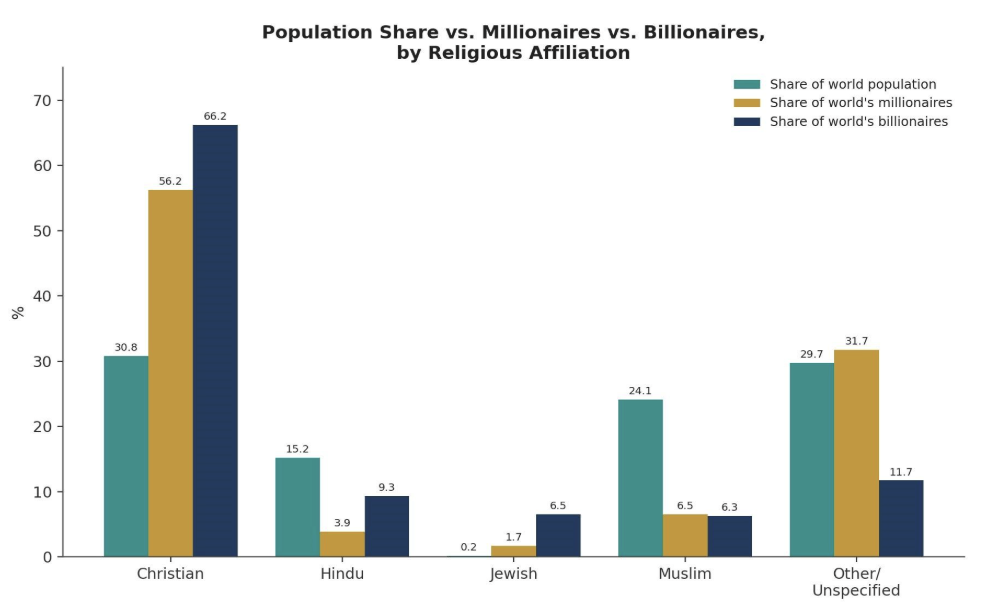
Population share vs. share of world's millionaires vs. share of world's billionaires, by religious affiliation. Sources: Pew Research Center (population); New World Wealth (millionaires); Wealth-X billionaire census data (billionaires, via secondary compilations — treat as directional, not precise).
Muslims remain underrepresented among billionaires by roughly the same ~4x factor seen among millionaires, while Hindus move from underrepresented among millionaires to roughly proportionate among billionaires — largely reflecting a small number of India-based billionaire dynasties (e.g., Mukesh Ambani, Gautam Adani) at the very top of the distribution. Within the Muslim billionaire population specifically, Forbes' 2025 World's Billionaires list recorded 38 Arab billionaires across eight MENA countries with a combined net worth of $128.4 billion (more than double 2024's $53.7 billion, driven substantially by Saudi Arabia's return to the list with 15 billionaires worth $55.8 billion).
Income by Religion (United States Focus)
Global income-by-religion data is sparse outside the United States. In Pew's 2014 Religious Landscape Study, 44% of Jewish households and 36% of Hindu households report annual income of $100,000 or more, compared with roughly 20% of Muslim households — close to the US national average for all adults (Pew Research Center, 2014 Religious Landscape Study).
Academic economic modeling projecting income by religion globally through 2050 finds Muslim societies' per-capita income trailing Christian societies today, but projects the gap narrowing due to faster population and economic growth in Muslim-majority regions ("The Religious Composition of Top Income and Wealth Groups, a Global Overview," academic paper, income-inequality-by-religion modeling, 1970-2050). The same research finds within-group inequality differs by religion: Christian and Jewish societies tend to have the most internally unequal income distributions, while Muslim, Hindu, and unaffiliated societies tend to be more internally equal.
Natural Resource Wealth in Muslim-Majority Countries
The clearest area where Muslim-majority countries substantially exceed their population share is natural-resource endowment — and it extends well beyond hydrocarbons.
Oil and gas
Seven of the world's top ten countries by proven oil reserves are OIC member states, led by Saudi Arabia (18.0% of global reserves), Iran (9.0%), Iraq (8.5%), Kuwait (6.0%), the UAE (5.9%), Libya (2.8%), and Nigeria (2.2%) (compiled from Farooqi, Natural Resources of Muslim Majority Countries, Muslim Mirror; Al Jazeera OIC/Arab League reporting). Oil export revenue in 2018 ranged from $237 billion (Saudi Arabia) down to $22 billion (Qatar) across the top producers. Iran also holds the world's second-largest proven natural gas reserves after Russia, and Qatar's gas exports (as LNG) underpin the highest GDP per capita of any Muslim-majority country, at roughly $114,648 in 2022 (World Bank).
Phosphates
Morocco holds an estimated 70-77% of the world's proven phosphate rock reserves — more than 50 billion metric tons, dwarfing the next-largest holders (China, Egypt, and others) — and is the world's leading exporter of phosphate rock, phosphoric acid, and phosphate fertilizers, critical inputs to global food security (USGS, Minerals Yearbook: Morocco, 2020-21; Atalayar, 2024). Morocco's phosphate-bearing deposits are also estimated to hold roughly 6 million tons of recoverable uranium — about twice known global uranium reserves — though large-scale extraction has not yet begun (Hespress, 2024).
Other minerals
Morocco additionally ranks among the world's leading producers of barite, arsenic trioxide, and cobalt, and has growing silver, lead, zinc, and small-scale gold output (USGS, 2020-21). Elsewhere in the Muslim-majority world, Indonesia is a top-three global producer of nickel and tin; Kazakhstan is a leading uranium producer; and Sudan and Mali are significant African gold producers. Taken together, these holdings mean Muslim-majority states supply a disproportionate share of the raw inputs to fertilizer, battery, and energy supply chains — even where that supply does not show up as household wealth.
This resource wealth behaves differently from household wealth: it is typically state-controlled, through national oil and phosphate companies (such as Morocco's OCP Group) and the sovereign wealth funds described above, rather than distributed as diversified household net worth.
Economic Footprint: GDP Attributable to Muslim-Minority Populations
A separate question from wealth by religion globally is how much economic activity is associated with Muslims living as minorities in non-Muslim-majority countries. Applying each country's estimated Muslim population share to its total nominal GDP gives a rough, proportional picture of scale — it indicates the size of the economy Muslims live within, not what they specifically produce, own, or earn.
Country / Region | Nominal GDP | Muslim share | Est. GDP attributable |
India | $3.9T | ~15% | ~$585B |
China | $18.8T | ~1.7% | ~$320B |
USA | $28.8T | ~1.1% | ~$317B |
Germany | $4.7T | ~6.6% | ~$310B |
France | $3.1T | ~8.8% | ~$273B |
Africa (minority-context)* | ~$1.6T (subset) | ~17% blended | ~$270B |
Russia | $2.2T | ~12% (mid of 11-14%) | ~$264B |
United Kingdom | $3.5T | ~6.3% | ~$221B |
Italy | $2.4T | ~4.5% | ~$108B |
Canada | $2.1T | ~4.9% | ~$105B |
Netherlands | $1.1T | ~7.1% | ~$78B |
Spain | $1.6T | ~4.4% | ~$70B |
Summed across these countries and regions, an estimated $2.92 trillion in annual GDP is attributable to Muslims living as a religious minority worldwide — likely an undercount, since it excludes minority Muslim populations in countries not itemized, such as the Philippines, Thailand, and Myanmar.
The Economic Role of Muslim Populations in Non-Muslim-Majority Countries
The proportional estimates above indicate scale, but a handful of countries have produced dedicated, bottom-up studies of Muslim minorities' economic contribution — workforce earnings, business ownership, consumer spending, and philanthropy — rather than inferring it from population share. Most non-Muslim-majority countries do not collect official statistics on economic output by religion at all; India's government, for instance, has confirmed no religion-wise breakdown of GDP exists.
United Kingdom. Muslims are about 6.0% of the UK population (2021-22 census, ~4 million people). A 2024 Equi think-tank report estimated British Muslims generate approximately £70 billion a year for the UK economy — roughly £42 billion from the workforce, ~£25 billion from Muslim-owned businesses, and £2.4 billion in charitable giving and volunteer time — roughly double a 2013 Muslim Council of Britain estimate of £31 billion (Equi, 2024; Muslim Council of Britain, 2013). London holds 85% of European Islamic banking sector assets, and the UK halal industry is valued at over £8 billion; the UK ranked 14th globally on DinarStandard's Global Islamic Economy Indicator in 2025/26.
United States. A 2025 report estimated Muslim American households generated approximately $170.8 billion in consumer spending in 2024. Muslim Americans are more likely to hold a college degree than the general public (46% vs. 38%), and Muslim-owned businesses support roughly 1.37 million US jobs (Institute for Social Policy and Understanding, 2025). About 50,000 Muslim physicians practice in the US — roughly 5% of all US physicians against a ~1% population share. Income is polarized within the community: 18% of households report income above $100,000 (below the 31% national average), while 33% report income below $30,000 (above the 24% national average), with Black Muslim Americans and non-citizen households disproportionately represented in the lower bracket. American Muslims report better average socioeconomic outcomes than French or British Muslims (ISPU comparative analysis).
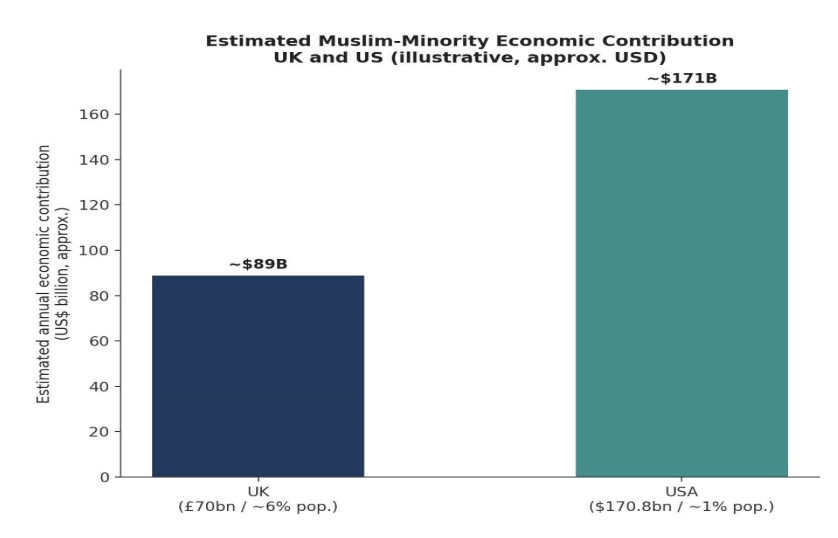
Illustrative comparison of UK and US Muslim-minority economic-contribution estimates, converted to approximate US$. Not directly comparable across sources — the UK figure covers workforce + business + charity; the US figure covers consumer spending only.
France. No comprehensive contribution study comparable to the UK/US reports exists for French Muslims; French research instead documents labor-market discrimination, which constrains rather than measures economic contribution. A PNAS field-experiment study found Muslim households in France earn on average about 400 fewer euros per month than comparable Christian households — roughly 15-17% of median French monthly income — a gap attributed substantially to hiring discrimination rather than differences in qualifications (Adida, Laitin & Valfort, PNAS, 2010; Valfort, World Development, 2020).
Russia. Estimates of Russia's Muslim population vary widely, from about 10-14% to higher figures cited by religious leaders, concentrated in the North Caucasus (Chechnya, Dagestan) and the Volga republics of Tatarstan/Bashkortostan; Russia itself has held OIC observer status since 2005. No dedicated bottom-up economic-contribution study comparable to the UK's exists, but Tatarstan — one of Russia's most economically developed regions, with a Muslim-majority population — has been designated a pilot region for Islamic (partnership) banking and finance, and hosts the annual KazanForum "Russia – Islamic World" summit, the country's largest platform for economic cooperation with OIC states (Tatarstan.ru, 2024; KazanForum, 2025). Tatarstan's halal product exports reached about $14 million in 2024, and the halal industry there spans catering, tourism, medicine, fashion, and IT (Salaam Gateway, 2022; KazanForum, 2025). As the table above shows, applying a Muslim population share of roughly 11-14% to Russia's $2.2 trillion economy implies on the order of $264 billion in GDP associated with Russia's Muslim population — a proportional estimate, not a measured contribution figure.
India and China. India hosts the world's third-largest Muslim population (roughly 200-213 million, about 15% of the national population), but the Indian government has stated no religion-wise GDP breakdown exists; the 2006 Sachar Committee Report describes Muslim economic outcomes without isolating a national-output figure, and online claims about a specific Muslim share of Indian GDP are not backed by any official or peer-reviewed source. No official or independent contribution estimate exists for China's Muslim minority populations (Hui, Uyghur, and others, collectively 1-2% of China's population); available research instead documents labor-market bias against Muslim job-seekers (ScienceDirect, 2019).
Australia. Australia does not collect official economic output data by religion. Muslims are about 3.2% of Australia's population (2021 Census, ~813,000 people), represented across professional, healthcare, education, and business sectors.
Global Islamic Economy, Real Assets, and Savings
Global Islamic economy. Separate from any single country's minority population, DinarStandard's 2025/26 State of the Global Islamic Economy Report estimates Muslim consumer spending across halal food, modest fashion, travel, media, pharmaceuticals, and cosmetics reached US 2.60 trillion in 2024, projected to reach US 3.56 trillion by 2029. Islamic finance assets (banking, sukuk, takaful, and investment funds) totaled roughly US 5.98 trillion in 2025 and are projected to approach US 10 trillion by 2029 — consistent with LSEG's forecast above. This spans both Muslim-majority and Muslim-minority countries; a meaningful share of Islamic finance activity is booked in London, a non-Muslim-majority financial center.
Real assets and wealth structures. A distinguishing feature of many Muslim-majority economies is the continued importance of real assets, particularly land and agricultural holdings, in household wealth. Real assets play a larger role in less-developed economies generally, given the prominence of agriculture and limited development of financial markets (UNU-WIDER, "The Global Distribution of Household Wealth"). This characterizes much of the Muslim-majority world outside the Gulf, where households often derive wealth from land and other tangible assets rather than diversified financial portfolios. The Gulf states are the exception: their wealth is shaped less by household land or financial-asset ownership and more by the state-controlled hydrocarbon revenues and sovereign funds described above.
Savings. Global comparative data on household savings rates by religion does not exist in a systematic, standardized form. Religion can still influence financial behavior: a 2024 study of more than 12,000 US households found religious households more likely to maintain savings accounts than non-religious households, a relationship linked to future-oriented preferences and risk aversion, and stronger among Catholics than Protestants specifically. In the Muslim world, saving behavior is also shaped by the prohibition of riba (interest); participation in conventional interest-based savings and investment products has historically been lower in some markets, while demand for Sharia-compliant alternatives — Islamic banking, sukuk, and takaful — has expanded significantly, among the fastest-growing segments of global finance. This reflects differences in how savings are accumulated and invested across religious communities, rather than necessarily lower saving rates.
References
- Academic paper. The Religious Composition of Top Income and Wealth Groups, a Global Overview (income-inequality-by-religion modeling, 1970-2050).
- Adida, C. L., Laitin, D. D., & Valfort, M.-A. (2010). Identifying barriers to Muslim integration in France. Proceedings of the National Academy of Sciences.
- Al Jazeera. (2025). Who are the 57 members of the Organisation of Islamic Cooperation?
- Altss. (2026). Largest Sovereign Wealth Funds in the World.
- Allianz. (2025). Allianz Global Wealth Report 2025.
- Central Intelligence Agency. The World Factbook — country entries.
- DinarStandard / Salaam Gateway. (2025-26). State of the Global Islamic Economy Report.
- Equi. (2024). The Economic Contribution of British Muslims to the UK's Growth and Prosperity.
- Farooqi, M. I. H. Natural Resources of Muslim Majority Countries. Muslim Mirror.
- Forbes Middle East. (2025). The World's Richest Arabs 2025.
- Forbes. (2025). The World's Billionaires 2025/26.
- Government of India, Sachar Committee. (2006). Report on the Social, Economic and Educational Status of the Muslim Community of India.
- Halal Times. (2025). Mapping the Muslim World's Capital Markets.
- Halal Times. (2026). Top 10 Richest Muslims in the World (2026 Forbes Data).
- Institute for Social Policy and Understanding (ISPU). (2025). The Economic Contribution of Muslims to the U.S. Economy; American Muslim Poll series.
- International Monetary Fund. (2026). World Economic Outlook, April 2026.
- KazanForum. (2025). Russia strengthens cooperation with OIC countries in the halal industry.
- LSEG. (2026). Tracking the rise of Islamic finance.
- McKinsey Global Institute. Global wealth has exploded. Are we all benefiting?
- Member states of the Organisation of Islamic Cooperation. Wikipedia.
- Muslim Council of Britain. (2013). The Muslim Pound.
- New World Wealth. (2015). Religious composition of the world's millionaires, via CNBC and secondary sources.
- Organisation of Islamic Cooperation. Wikipedia.
- Pew Research Center. (2025). Countries with the most Muslims & global Muslim population change, 2010-2020.
- Pew Research Center. (2025). How the Global Religious Landscape Changed From 2010 to 2020.
- Pew Research Center. 2014 Religious Landscape Study.
- PRRI. American Values Atlas.
- ScienceDirect. (2014). Explaining the Muslim employment gap in Western Europe.
- ScienceDirect. (2019). Anti-Muslim bias in the Chinese labor market.
- SESRIC. (2011/2007). Population Structure of the OIC Member Countries; OIC Day Reception remarks.
- Salaam Gateway. (2022). Russia – Islamic World: Kazan Summit & World Halal Day.
- Tatarstan.ru. (2024). Islamic banking and finance conference remarks.
- UBS. (2025-26). UBS Global Wealth Report, 2025 and 2026 editions.
- UNU-WIDER. The Global Distribution of Household Wealth.
- US Geological Survey. Minerals Yearbook: Morocco, 2020-21; 2017-18.
- Atalayar. (2024). Morocco, a leader in phosphate reserves.
- Hespress. (2024). Morocco dominates global Phosphate reserves with 70% share.
- Valfort, M.-A. (2020). Anti-Muslim discrimination in France: Evidence from a field experiment. World Development.
- Visual Capitalist. (2026). Where the World's $13T in Sovereign Wealth Is Held.
- Wealth-X. Billionaire census data on religious composition of world billionaires, via secondary compilations.
- Universal Asset Owners. (2026). The World's Largest Sovereign Wealth Funds.
- World Population Review. National population and religion compilation, 2024-25.
If you found this article informative & would like to support further research, click here to donate!
